Google Data Studio vs Klipfolio
This pages makes a detailed comparison of Google Data Studio vs Klipfolio.
When Google Data Studio became available for free in 2017, it sent shivers through the market. Initially it was thought that it would quickly be Game Over for paid alternatives like Klipfolio (Infogram, Geckoboard and the rest). But, that did not materialize. Even as Google Data Studio has evolved from a very basic beta product to a more complete reporting tool, Klipfolio, the clear market leader in the SME reporting market, is still alive and kicking.
Google Data Studio vs Klipfolio: the tools


Google Data Studio is Google's free data visualisation and business intelligence reporting tool. It was launched in the middle of 2016 in a freemium model, became free in feb 2017 and came out of beta mode in October 2018.
Klipfolio is an online dashboard platform for building powerful real-time business dashboards for your team or your clients. Launched in an online version in 2013, but has been around since 2003 as a downloadable desktop application.
Before you start: af few fundamental questions
Simply put: If the answer to the first question is yes and you answer yes on any or all of the questions 2 through 5, Klipfolio is the tool for you. If you haven't, it makes sense to decide after reading this blog. Move to the detailed comparison
1. Willing to pay for support & design?
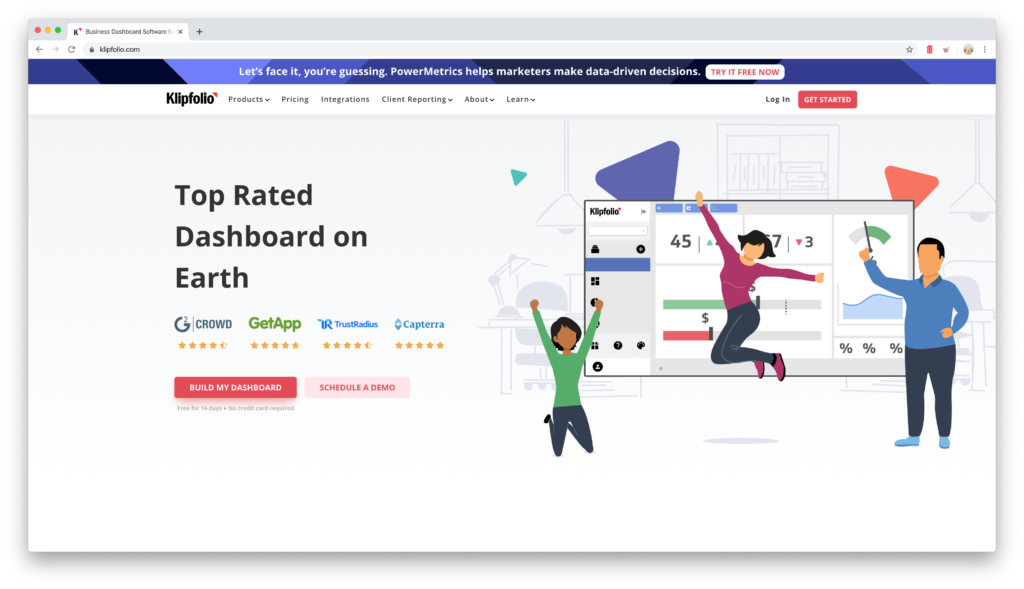
Klipfolio is a paid service (starts at 49 dollars a month) with award winning support, but if you are not willing or able to pay a modest fee for awesome service and an overall better looking dashboard, Google Data Studio is your choice. But it might still make sense to read on to see the detailed comparison.
2. See the key metrics from a wide range of platforms?
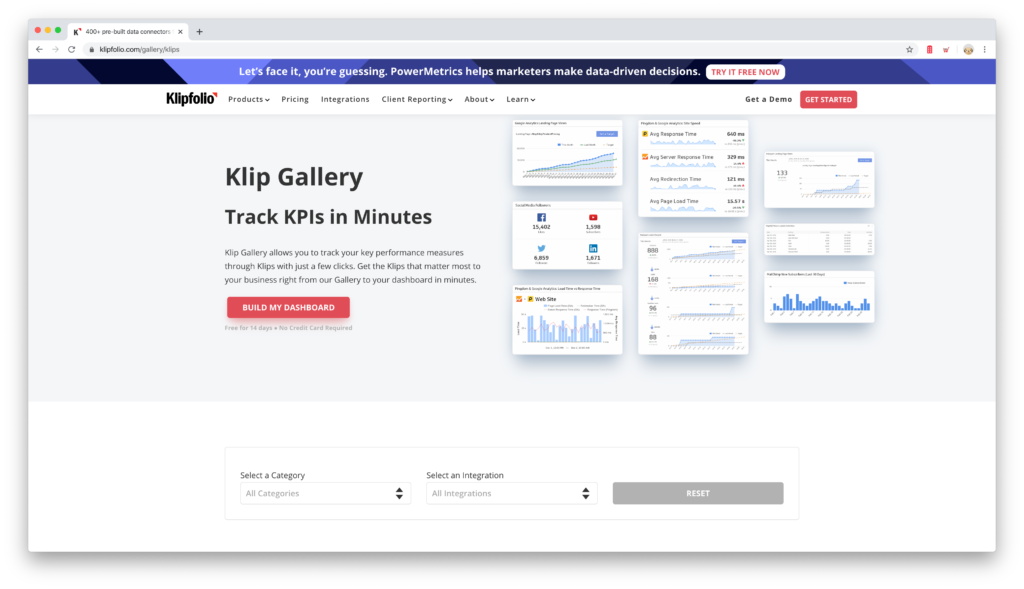
If you need an easy way of connecting to a very wide variety of platforms (from Adform to Zendesk), and for each, you only need to see the key metrics, Klipfolio is by far the best option. Although Data Studio has templates available, it can not compete with Klipfolio’s klip gallery with hundreds of pre-built klips from 400+ platforms.
3. Do you need to maintain dashboards at scale?
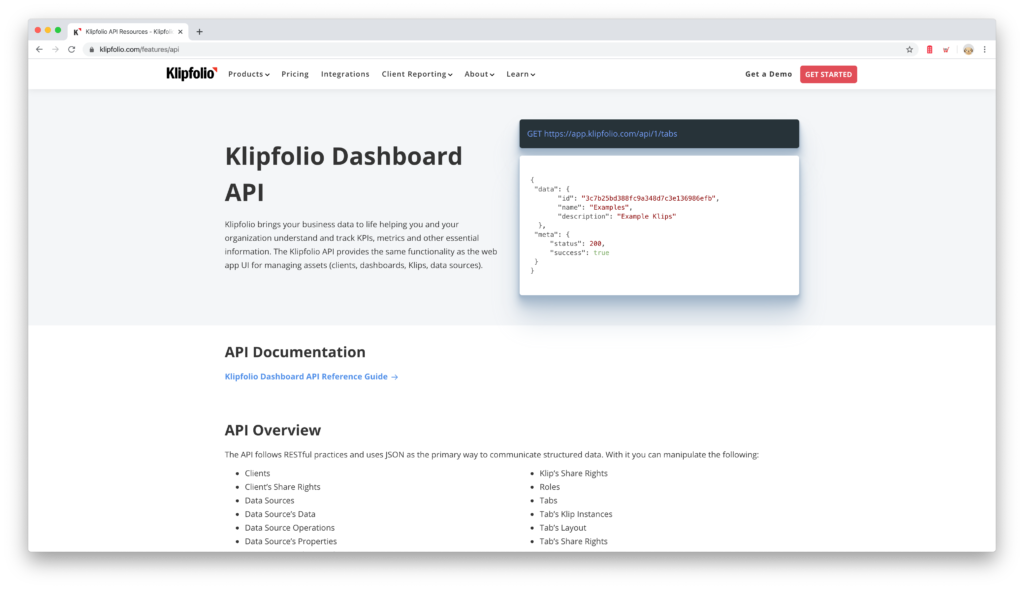
If you need to deploy, maintain and upgrade more than a few dashboards on a regular basis, Klipfolio has more and smarter options. If this is key, my advice is to go for Klipfolio, it will be worth every penny. You can find a more detailed comparison here.
4. Do you need to manage access on detailed level?
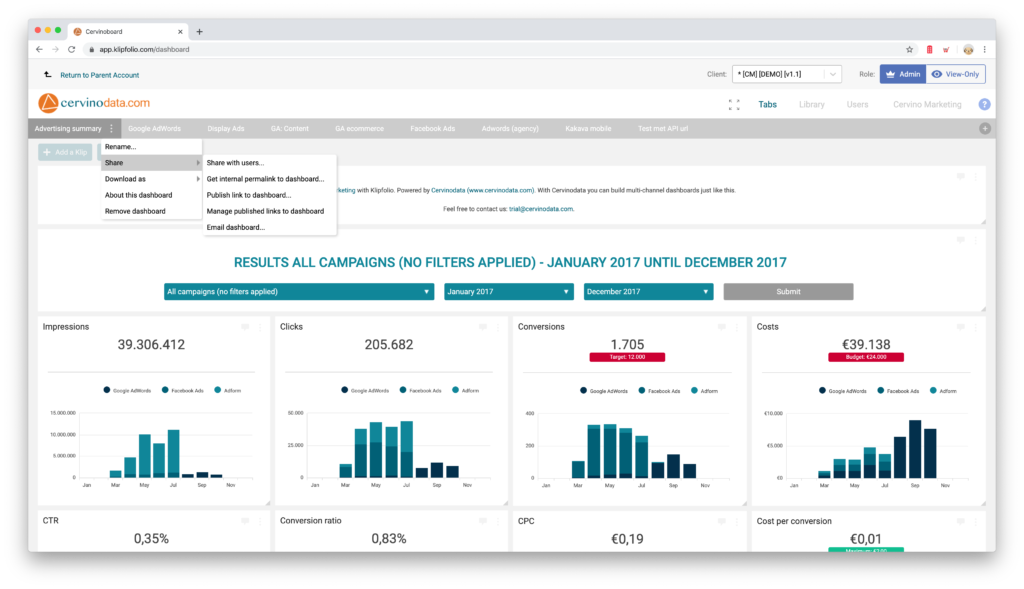
If managing access to multiple dashboards on a detailed level is key for you, Klipfolio is your best choice. See details here
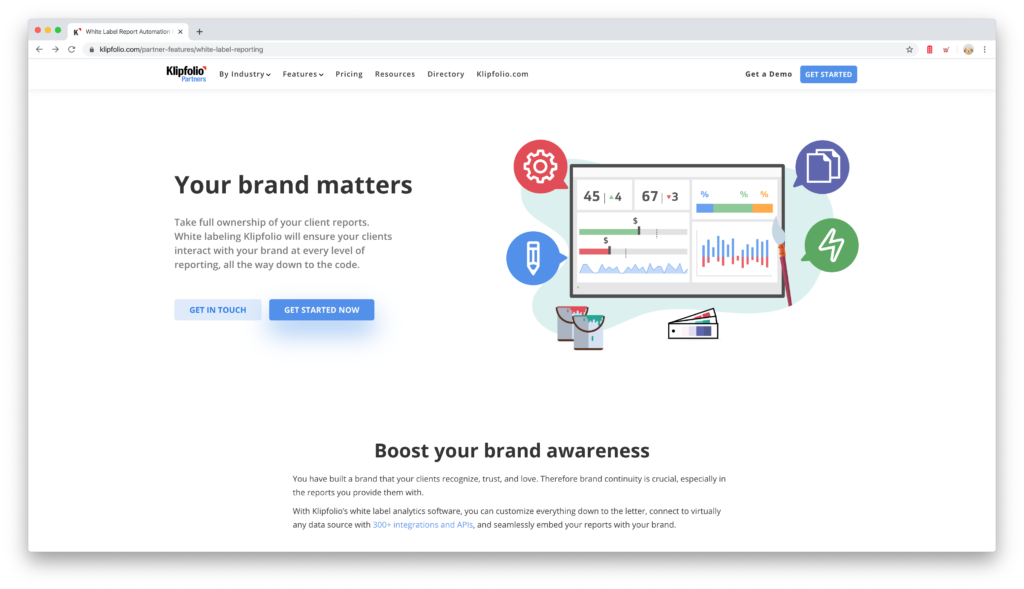
5. Do you want a full brand experience?
For those users (mostly agencies) that wish to give their users the full brand experience, from a custom url, to custom style sheet and customised email sender address from system emails, Klipfolio is your choice. In particular if you wish to deploy custom styles at scale (see question 3 above). If you can not decide now, check out the detailed comparison related to branding here
Google Data Studio vs Klipfolio, a detailed comparison
The more questions are answered with a strong yes, the more likely it is that Klipfolio is the best tool for your needs. If not, it makes sense to check out the detailed comparison and make up your mind after reading this blog. The comparison is split in the different phases of the dashboard creation process. Move to the summary table.
Getting started quickly
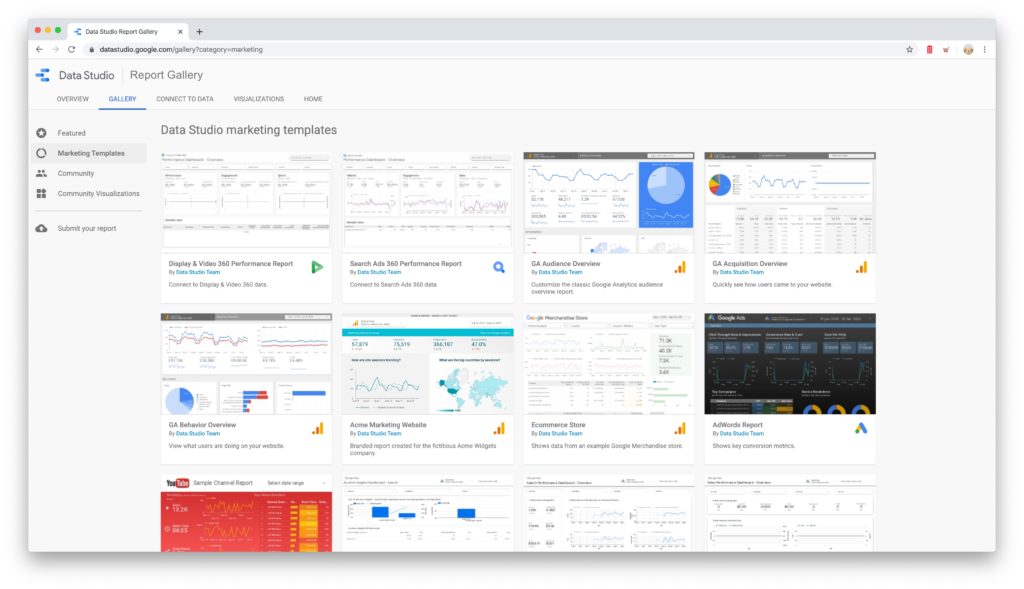
Where Data Studio has more Dashboard templates available then Klipfolio, Klipfolio allows you to easily combine key metrics from multiple platforms in one dashboard. Also, both the pre-built dashboard templates and klips in Klipfolio have a better overall look & feel.
| Getting started quickly | Google Data Studio | Klipfolio |
|---|---|---|
| Dashboard template gallery | 50+ | 12 |
| Klip gallery | 24 | 200+ |

Getting data in
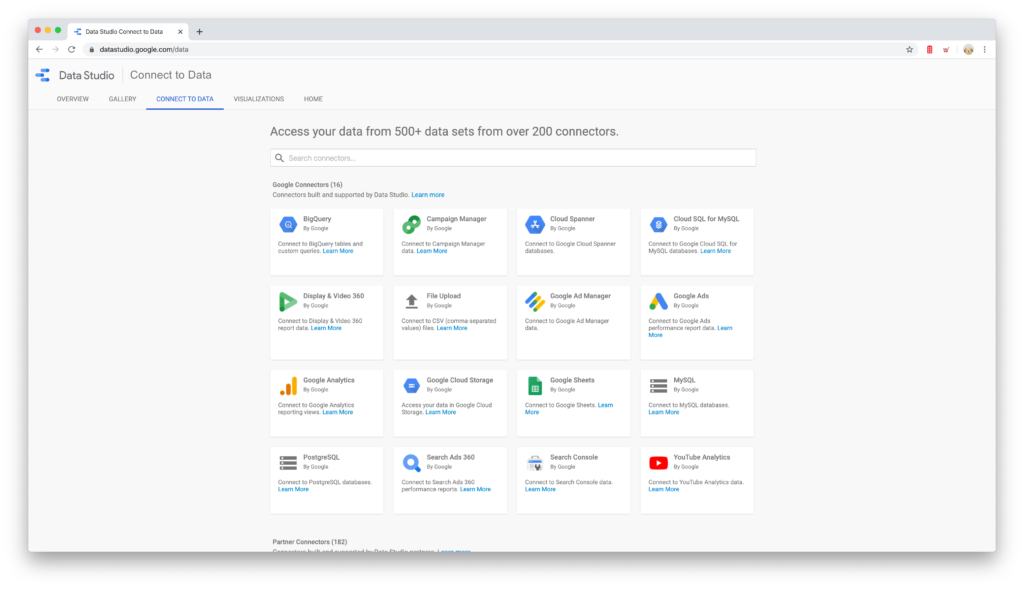
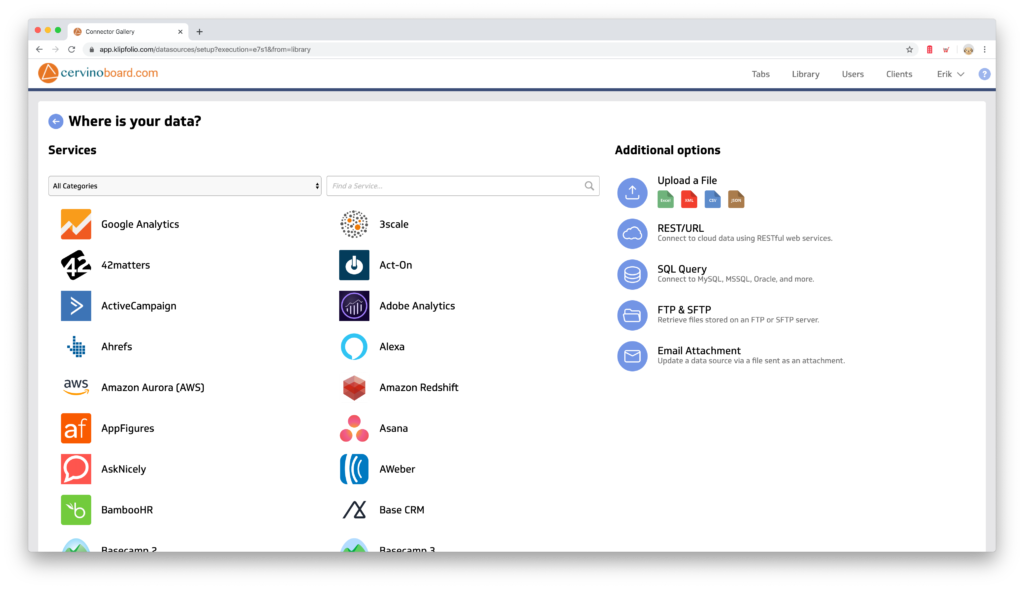
A distinct feature is that Klipfolio has 400+ native integrations. This allows you to connect directly to (probably) all platforms you use without having to code. Data Studio offers a connector gallery with a bunch of native connectors to the Google stack and a growing list of community connectors. The positive thing about Data Studio's community connector is that it allows third parties (like Cervinodata) to built on top of Data Studio, allowing for a lot of flexibility. The downside of this is that there is a lot of duplicates in the connector gallery and most of them are paid services.
| Getting data in | Google Data Studio | Klipfolio |
|---|---|---|
| Native integrations | 16 | 400+ |
| "Common sense connectors" | - | email, ftp, sftp, rest url |
| Community connectors | 200 | - |
| Data blending | yes | yes |
| Blend data in formulas | no | yes |
| Data modelling | no | yes |
| Data refresh | up to every hour | up to every minute |
| Targets vs actuals | yes, but limited | yes, wide range |
Save time getting the data right.
Working with multiple accounts, clients and / or platforms? Save lots of time. Cervinodata enables you to prepare all your data before you use it in Data Studio, Klipfolio or both.
Building dashboards
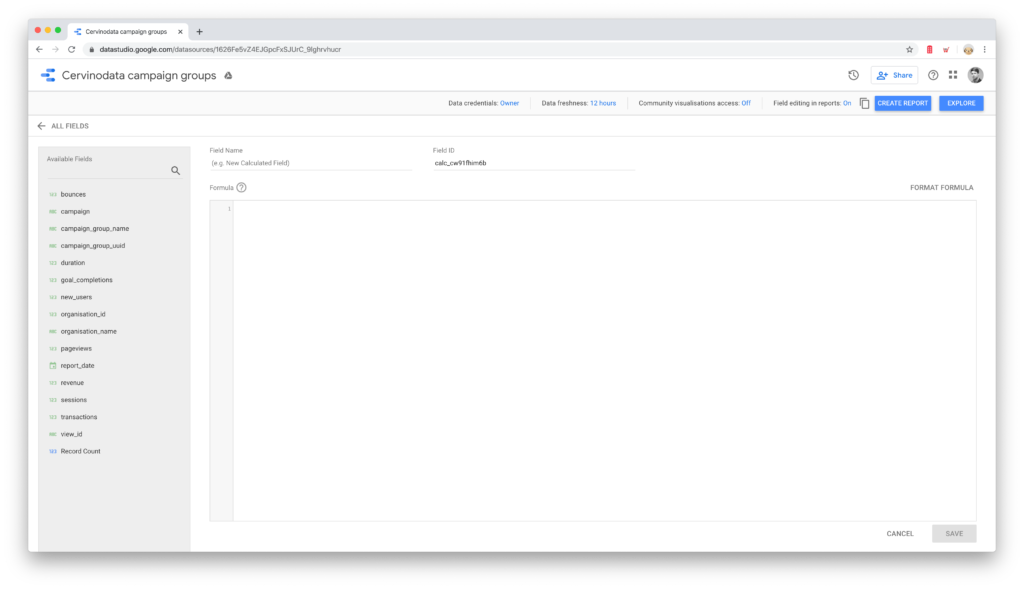
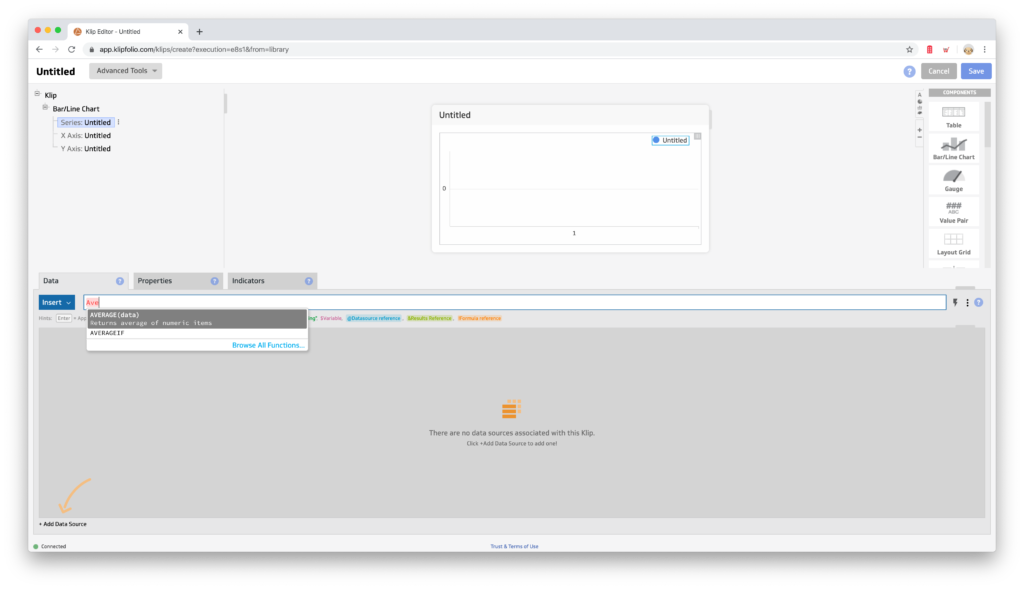
Both Data Studio and Klipfolio offer a wide range of options to build custom dashboards. Both have a formula editor with which you can make more advanced computations (from average to standard deviation). Key differences between the two is that with Klipfolio, you can build formulas that blend multiple data sources. You will definitely miss this in Data Studio if you go beyond the basics.
Both offer features that make life a bit easier, like "snap to grid". In Klipfolio, adding and working with custom variables is more advanced. This allows you to build custom dropdowns (to filter data) faster and make them more advanced.
| Building dashboards | Google Data Studio | Klipfolio |
|---|---|---|
| Formula editor | yes | yes |
| Snap to grid | yes | yes |
| Custom filters | basic | advanced |
Visualising data - part one
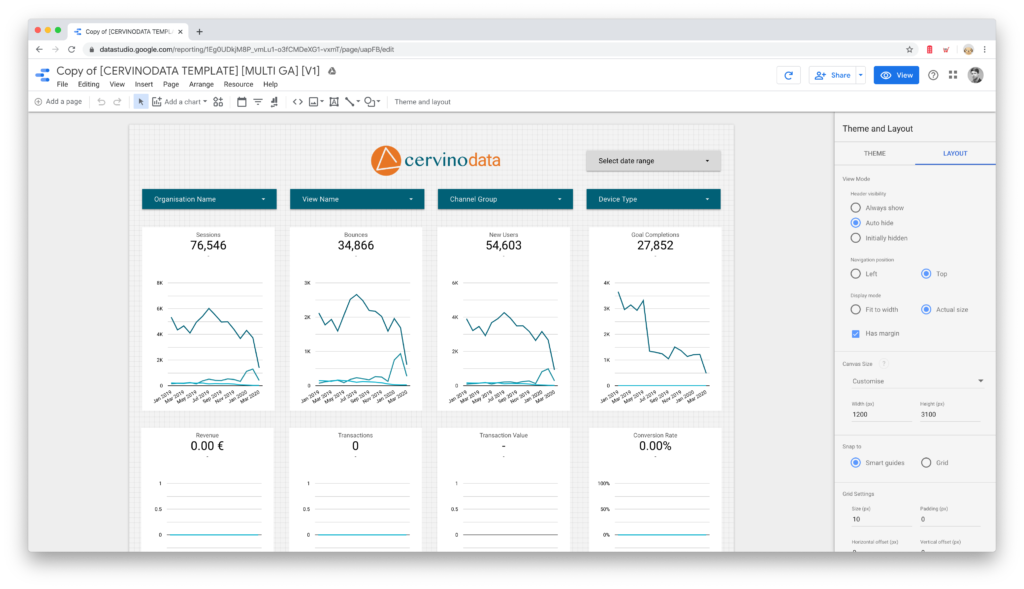
Once you get the right data in, you want your data to look as pretty as possible. Both tools offer various ways to display data. There are some fundamental differences between Data Studio and Klipfolio when it comes to sophistication. Data Studio is on par with Klipfolio when it comes to graph types and options (see part two), it lacks the sophistication when it comes to overall design.
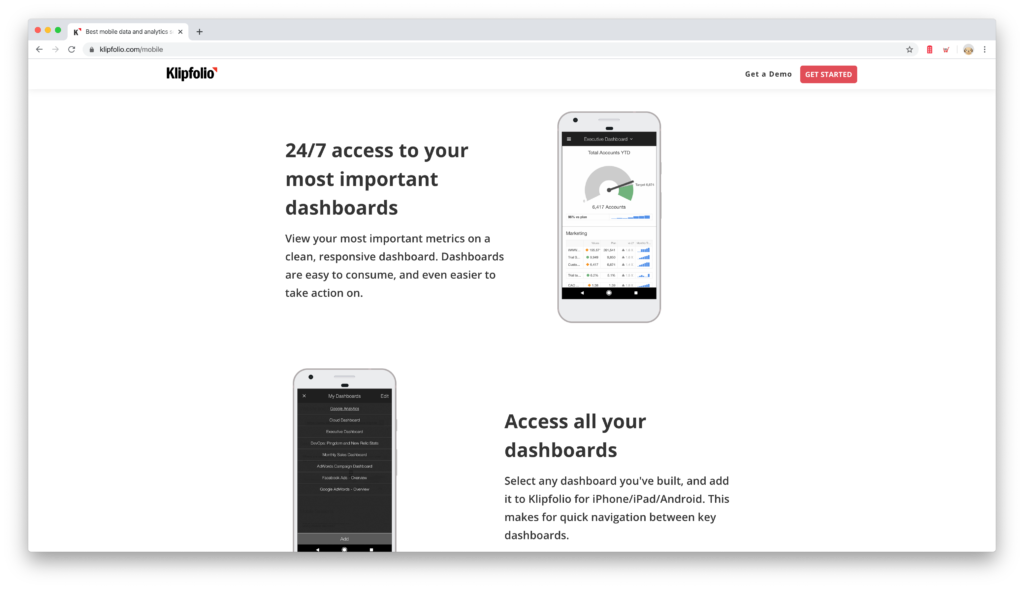
Klipfolio dashboards are responsive, so look good on larger and smaller screens. Klipfolio has a mobile app to check your data on the go. And Klipfolio offers a built in TV mode. I know it is possible to make Google Chrome full screen and resemble a full screen mode, but it just soo much more convenient to simply press the TV mode and be done.
| Visualising data - one | Google Data Studio | Klipfolio |
|---|---|---|
| Advanced tables | pivot, drilldown | drilldown |
| Drilldown in graphs | yes | in PowerMetrics |
| Custom canvas size | very flexible | templates, # of columns |
| Custom graph colors | yes | yes |
| TV screen mode | - | yes |
| Mobile app | - | yes |
| Responsive in browser | - | yes |
| Indicators in graphs | - | yes |
Visualising data - part two
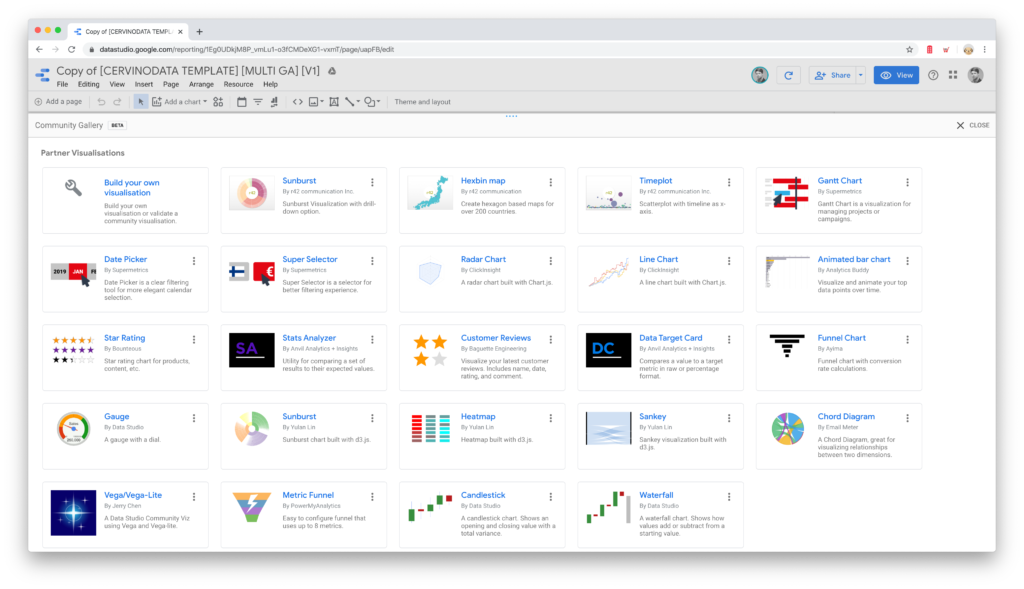
In the table below you can find a detailed comparison between Data Studio and Klipfolio when it comes to specific ways to present data. The difference is somewhat small and mostly a matter of taste. Generally, from the get-go, the Klipfolio visualisations are better looking, but Data Studio has a community connector gallery available which makes it more flexible. And if you put some effort in it, you'll be able to make the graphs look good in Data Studio too.
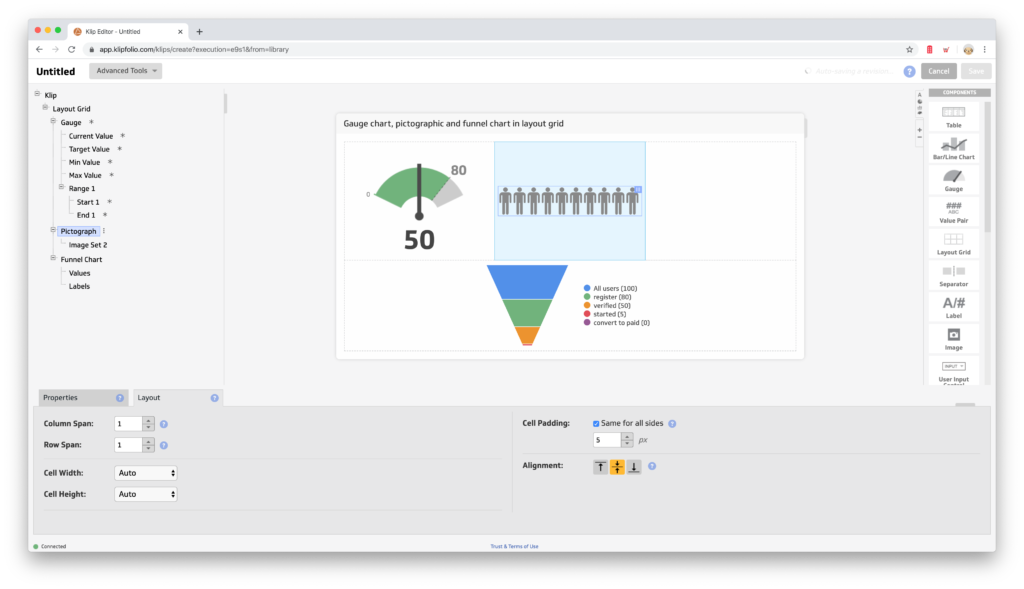
One key differentiator is that Klipfolio is very easy in combining multiple data sources in one graph, table of other form op visualisation. If you think you will need this occasionally, do not take this lightly. You will love how easy this is with Klipfolio (and how tedious in Data Studio).
| Visualising data - two | Google Data Studio | Klipfolio |
|---|---|---|
| Line charts | yes | yes |
| Bar charts | yes | yes |
| Combo charts | one data source | multiple data sources |
| Pie chart | yes | yes |
| Pictographics | - | yes |
| Table | yes | yes |
| Pictographics | - | yes |
| Maps | yes | yes |
| Scorecard | yes | yes |
| Scatter plot | yes | yes |
| Bullet chart | yes | yes |
| Gauge chart | community connector | yes |
| Treemap | yes | - |
| Url embed | yes | yes |
| Text | yes | yes |
| Images | yes | yes |
| Lines | yes | yes |
| Rectangles & circles | yes | - |
| Funnel charts | - | yes |
| Community visualisations | yes | - |
Maintenance
This is what Data Studio vs Klipfolio looks when comparing the tools on manageability and maintenance at scale.
| Maintenance | Google Data Studio | Klipfolio |
|---|---|---|
| API to copy/paste templates | - | yes |
| -------------- | -------------- | -------------- |
| Detailed ways of providing access | - | yes |
| -------------- | -------------- | -------------- |
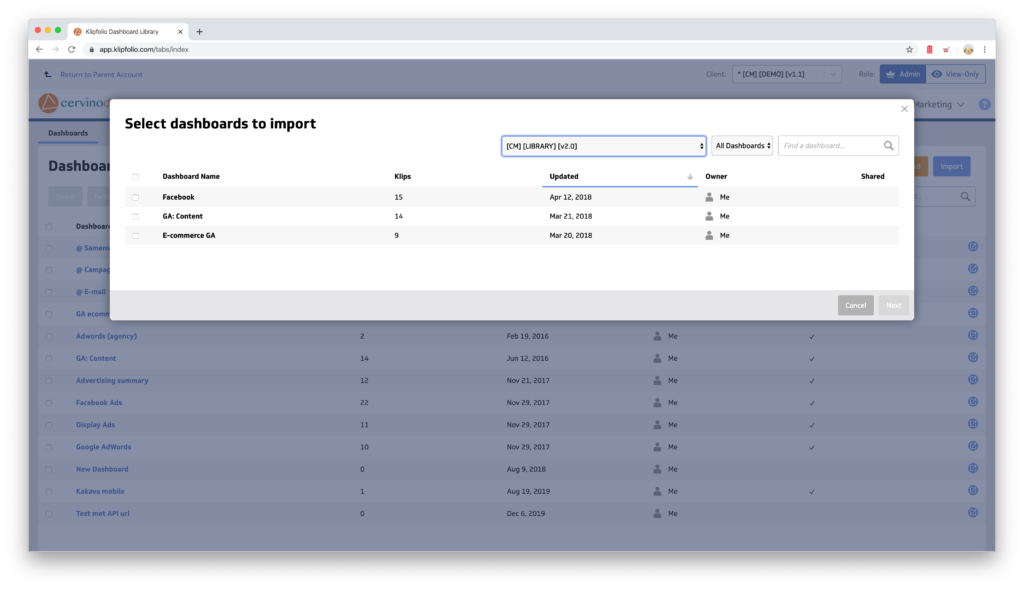
| Manual multiplication | save as... | import... |
| -------------- | -------------- | -------------- |
| CSS to change the look & feel in all dashboards | - | yes |
| -------------- | -------------- | -------------- |
| Versioning system to change dashboards at once | - | yes |
| -------------- | -------------- | -------------- |
| Enterprise options | - | private network, premium support, upgraded data processing. |
Branding
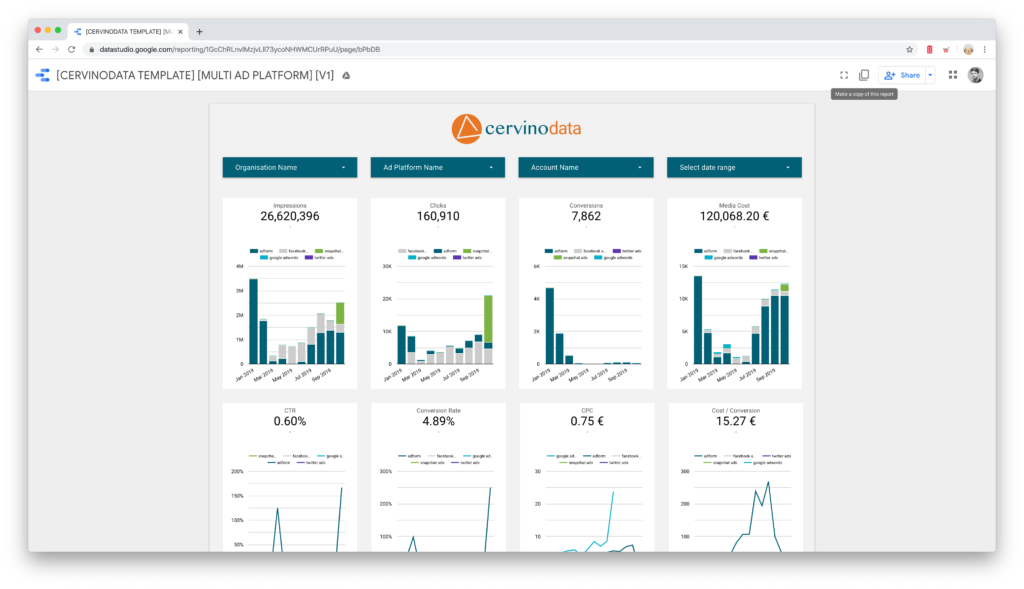
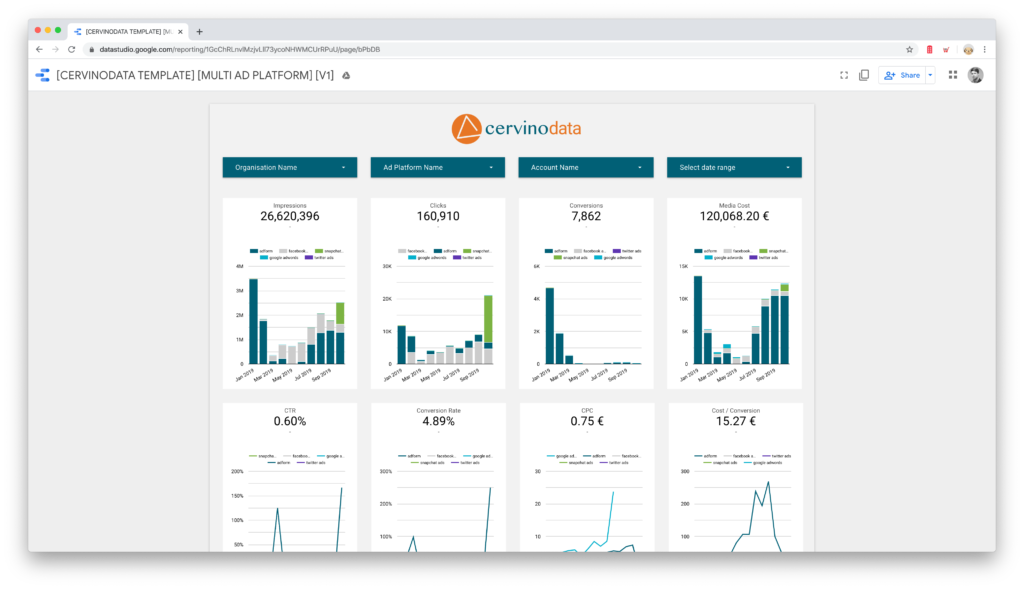
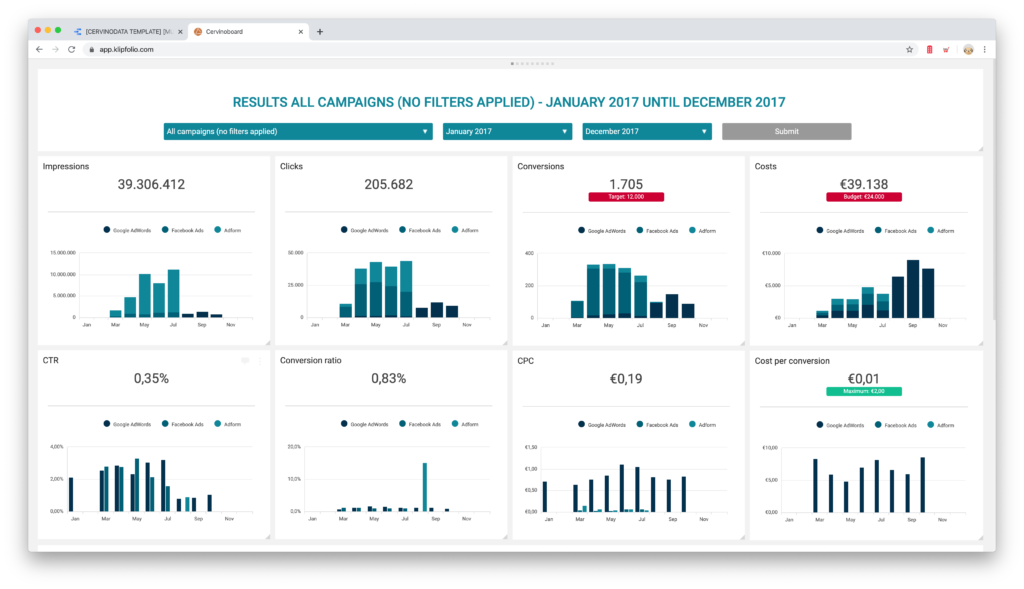
If the overall look & feel and front to back customer experience is key for you, Klipfolio is the best choice for you. The overall appearance is just more professional and more sophisticated. And Klipfolio offers (paid) features like domain aliasing, white label, custom style sheet, etc to fully customize the experience for your users.
| Branding | Google Data Studio | Klipfolio |
|---|---|---|
| CSS | - | yes |
| Standard themes | a bunch, not really pretty | licht, dark, slate |
| Domain aliasing | - | yes |
| white label | - | yes |
| custom url | - | yes |
Other things to consider
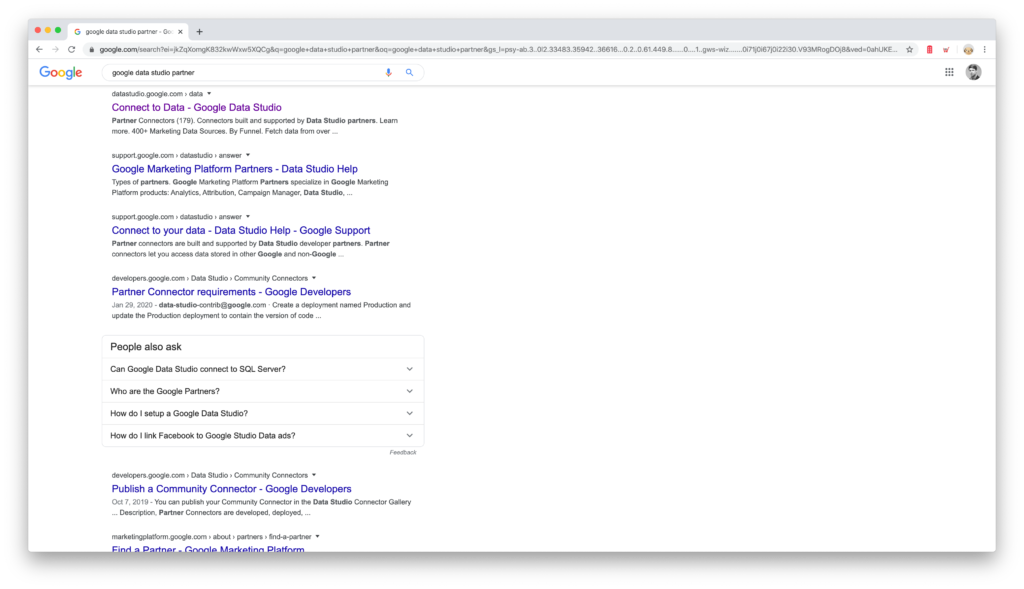
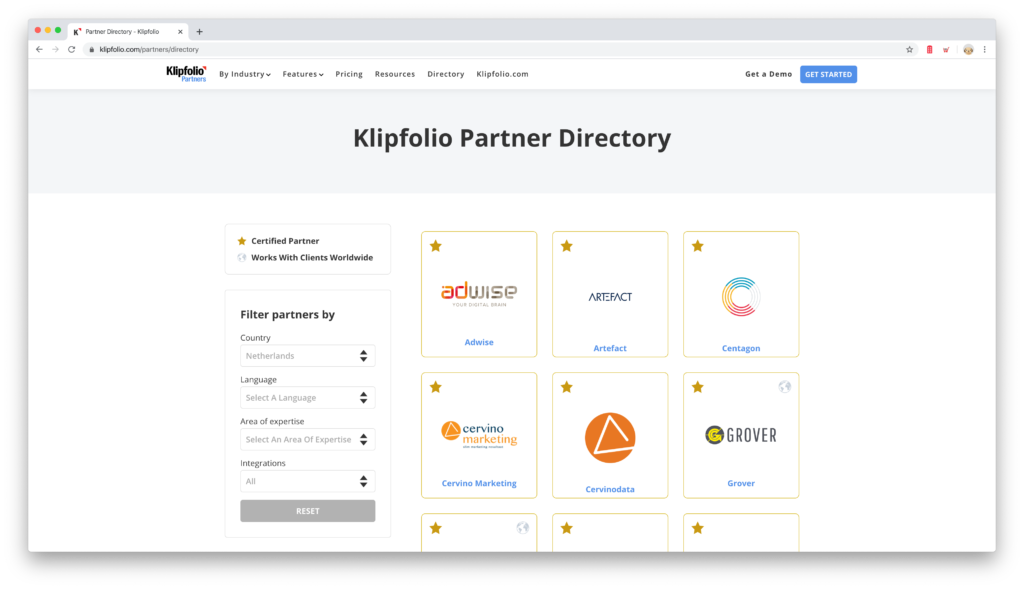
There are a couple of other things to consider when making your choice between Data Studio and Klipfolio. Of course there is a price difference, we talked about that. Another thing to keep in mind is that you might need help. Klipfolio has it's own super fast and very friendly support team and has a community of partners that can help you out building dashboards, training and the like. Data Studio offers no support and the partners are basically either offering paid connectors of free templates.
| Other considerations | Google Data Studio | Klipfolio |
|---|---|---|
| Price | free | from 49 $ |
| Support & service | - | great & superfast |
| Partner network | yes | yes |
Start a Cervinodata Free plan
Our free plan comes with 182 days data retention and weekly data refresh. Blend data from multiple ad platforms (like Facebook Ads, Google Ads and more) with Google Analytics and get your campaign performance reporting up and running in minutes. Free templates available.
Google Data Studio vs Klipfolio
Below you can find a summary of all the components in our comparison. Move up when you need explanation for each of the topics.
| Getting started quickly | Google Data Studio | Klipfolio |
|---|---|---|
| Dashboard template gallery | 50+ | 12 |
| Klip gallery | 24 | 200+ |
| Getting data in | Google Data Studio | Klipfolio |
|---|---|---|
| Native integrations | 16 | 400+ |
| "Common sense connectors" | - | email, ftp, sftp, rest url |
| Community connectors | 200 | - |
| Data blending | yes | yes |
| Blend data in formulas | no | yes |
| Data modelling | no | yes |
| Data refresh | up to every hour | up to every minute |
| Targets vs actuals | yes, but limited | yes, wide range |
| Building dashboards | Google Data Studio | Klipfolio |
|---|---|---|
| Formula editor | yes | yes |
| Snap to grid | yes | yes |
| Custom filters | basic | advanced |
| Visualising data - one | Google Data Studio | Klipfolio |
|---|---|---|
| Advanced tables | pivot, drilldown | drilldown |
| Drilldown in graphs | yes | in PowerMetrics |
| Custom canvas size | very flexible | templates, # of columns |
| Custom graph colors | yes | yes |
| TV screen mode | - | yes |
| Mobile app | - | yes |
| Responsive in browser | - | yes |
| Indicators in graphs | - | yes |
| Visualising data - two | Google Data Studio | Klipfolio |
|---|---|---|
| Line charts | yes | yes |
| Bar charts | yes | yes |
| Combo charts | one data source | multiple data sources |
| Pie chart | yes | yes |
| Pictographics | - | yes |
| Table | yes | yes |
| Maps | yes | yes |
| Scorecard | yes | yes |
| Scatter plot | yes | yes |
| Bullet chart | yes | yes |
| Gauge chart | community connector | yes |
| Treemap | yes | - |
| Url embed | yes | yes |
| Text | yes | yes |
| Images | yes | yes |
| Lines | yes | yes |
| Rectangles & circles | yes | - |
| Funnel charts | - | yes |
| Community visualisations | yes | - |
| Maintenance | Google Data Studio | Klipfolio |
|---|---|---|
| API to copy/paste templates | - | yes |
| -------------- | -------------- | -------------- |
| Manual multiplication | save as... | import... |
| -------------- | -------------- | -------------- |
| CSS to change the look & feel in all dashboards | - | yes |
| -------------- | -------------- | -------------- |
| Versioning system to change dashboards at once | - | yes |
| -------------- | -------------- | -------------- |
| Enterprise options | - | private network, premium support, upgraded data processing. |
| Branding | Google Data Studio | Klipfolio |
|---|---|---|
| CSS | - | yes |
| Standard themes | a bunch, not really pretty | light, dark, slate |
| Domain aliasing | - | yes |
| White label | - | yes |
| Custom url | - | yes |
| Other considerations | Google Data Studio | Klipfolio |
|---|---|---|
| Price | free | from 49 $ |
| Support & service | - | great & superfast |
| Partner network | yes | yes |
Start a Cervinodata Free plan
Our free plan comes with 182 days data retention and weekly data refresh. Blend data from multiple ad platforms (like Facebook Ads, Google Ads and more) with Google Analytics and get your campaign performance reporting up and running in minutes. Free templates available.
