LinkedIn Ads Data Studio template
How to use Cervinodata's LinkedIn Ads data studio template
Google Data Studio is a powerful way to report on key summary data from all sorts of sources. Many online marketing agencies and online marketers use Data Studio for reporting or dashboard purposes. Data Studio offers multiple ways to connect data to a report, this is done through a Data Studio connector. Data Studio connectors can connect Native Google service data to a report, but it there is a growing community of third party connectors that allow you to connect for instance LinkedIn Ads data to Data Studio. Cervinodata offers Data Studio connectors for the main advertising platforms. The Cervinodata connectors come with specific features that will save you time and frustration when reporting on data.
Example of the LinkedIn Ads data studio template
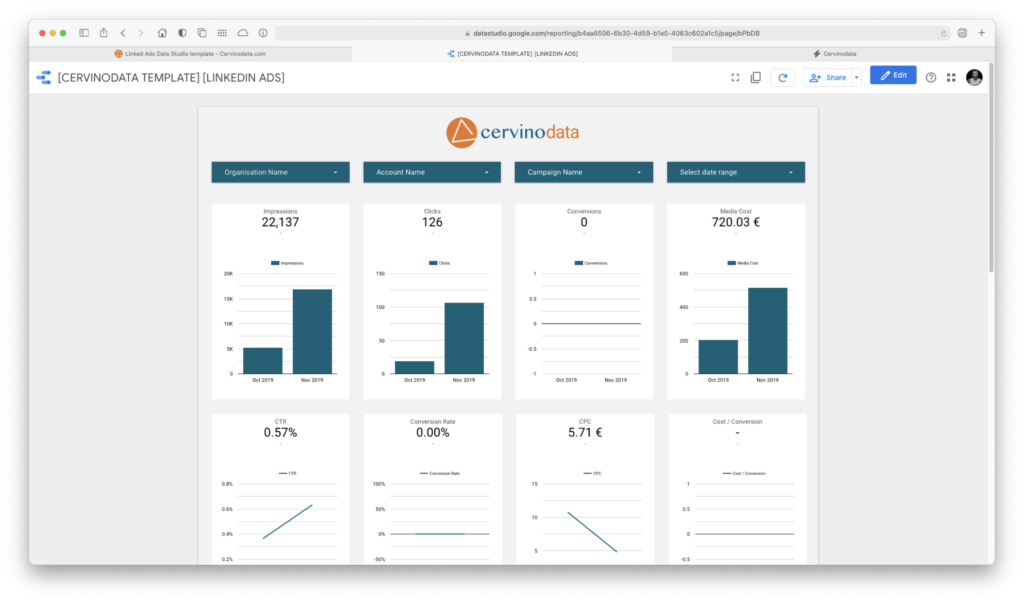
What's in the LinkedIn Ads Data Studio template?
This article shows you what's inside the template, how exactly Cervinodata's Data Studio template for multiple LinkedIn Ads accounts works and how easy it is to add or remove an account.
Dropdowns for easy filtering
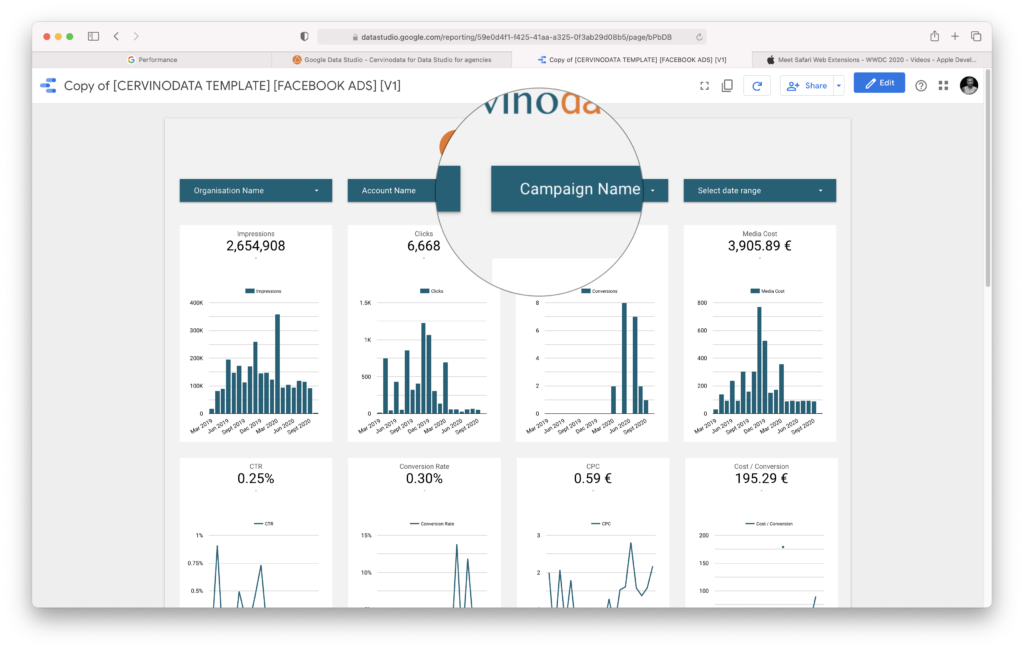
The LinkedIn Ads template has multiple dropdowns for easy filtering. The templates can be adjusted to your needs, or you can use the data set that is underneath the template and build your own report from scratch. The dropdowns are simply the frequently asked features when we build a Data Studio dashboard, and they show the unique features Cervinodata has to offer.
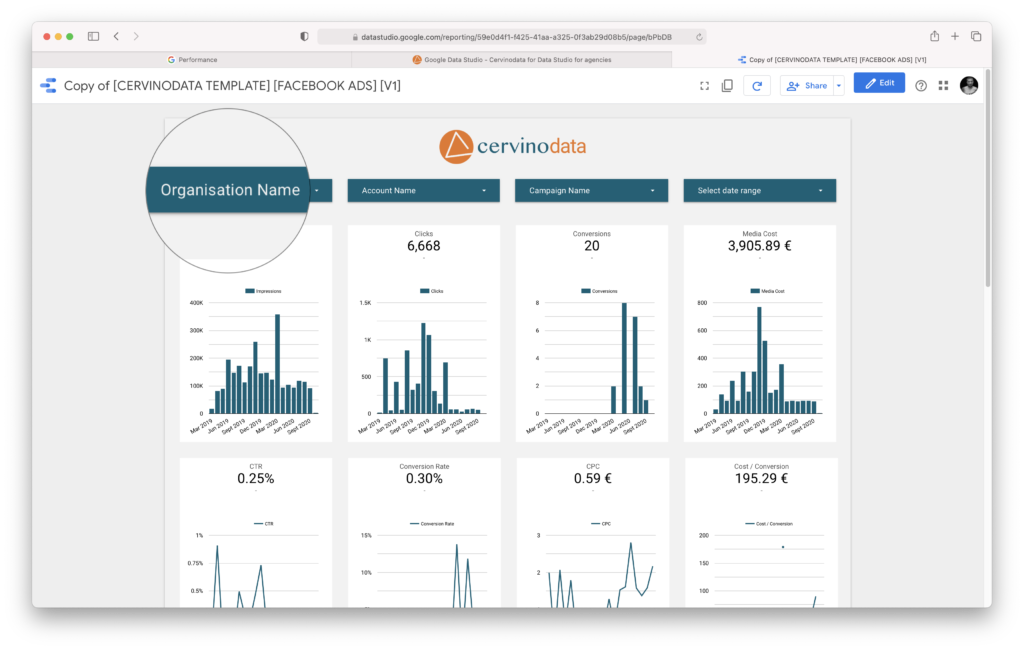
Multiple organisations
Cervinodata allows you to filter data by Organisation. In the case of multiple LinkedIn Ads accounts it allows you to group a couple of ad accounts to one organisation (Brand A), and a couple of others to another organisation (Brand B) and still be able to report on all the ad accounts, without having to change blending settings.
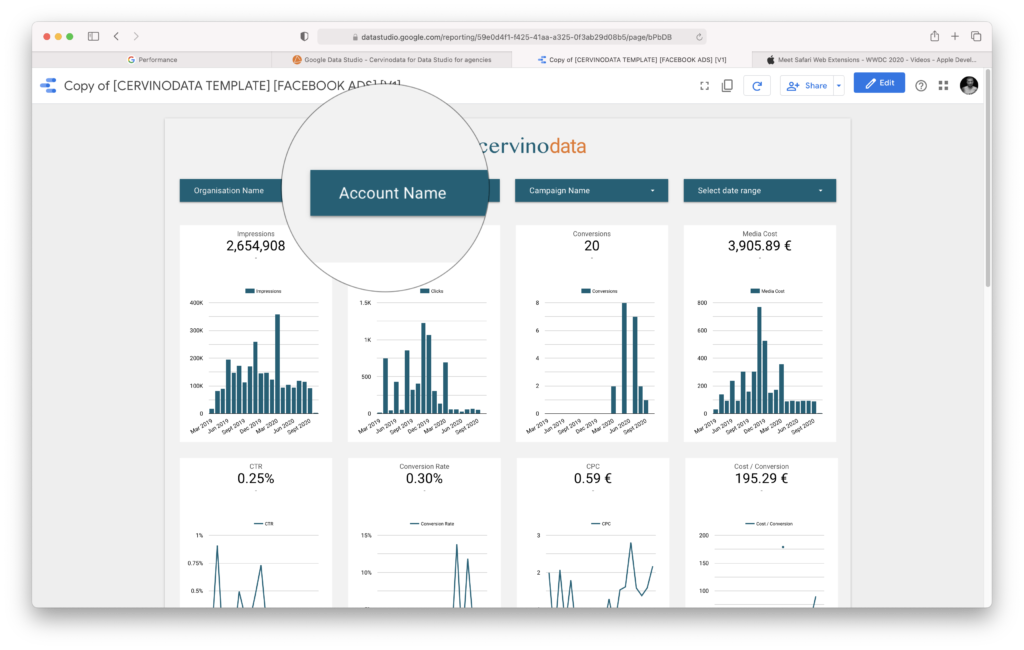
Multiple accounts
Easily report on one or multiple accounts without complexity. If you have multiple accounts in your report you can easily deselect any or all but one, and all graphs and tables will be filtered. If you want to report on all your accounts in a topline report, you can also use our Ad data agency overview (See here to find out more).
Historic data
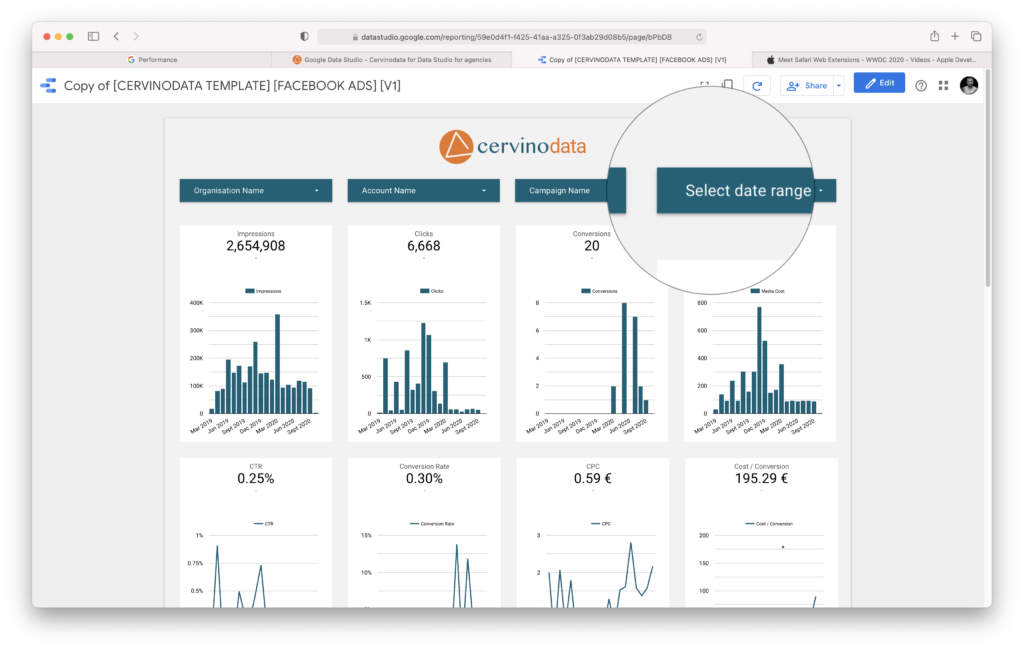
In the template, we have chosen to show the results in the graphs by months, but for more details, it's possible to drill down the graphs to show the results (by ad account) by day. In the Data Studio connector, the data is available per day. For Free plans, this data history is limited to 182 days, for all paid plans, more historic data is available.
Campaigns
Each Cervinodata connector comes with data per campaign included. This means you can use the Cervinodata LinkedIn Ads Data Studio connector for reporting on all of your LinkedIn Ads by account(s) or by campaign(s). Our connectors with "filter" in the name include the campaign grouping feature (more on campaign grouping here).
Start a Cervinodata Free plan
Our free plan comes with 182 days data retention and weekly data refresh. Blend data from multiple ad platforms (like Facebook Ads, Google Ads and more) with Google Analytics and get your campaign performance reporting up and running in minutes. Free templates available.
What metrics are available in the LinkedIn Ads template?
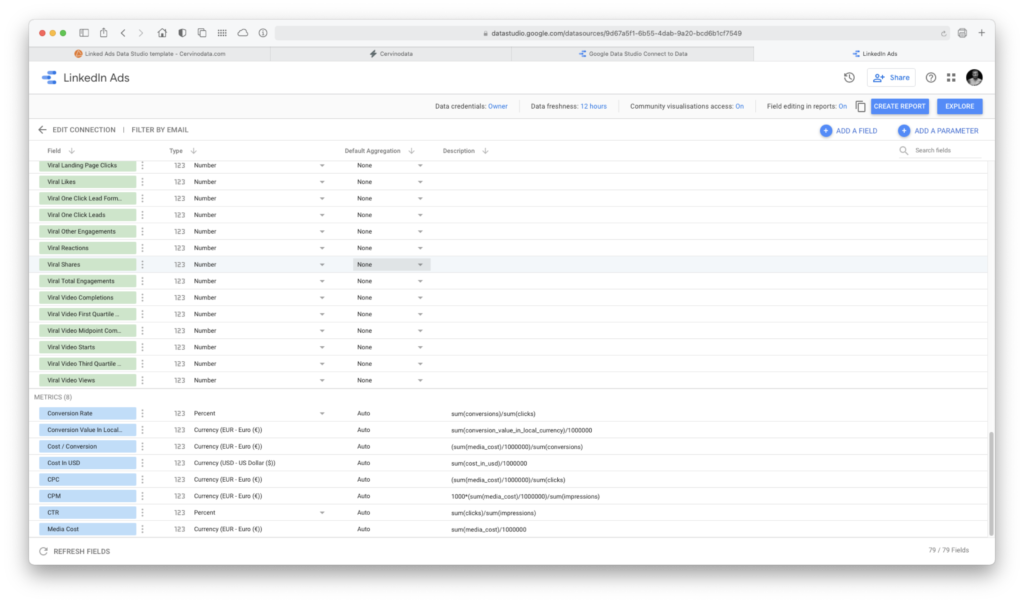
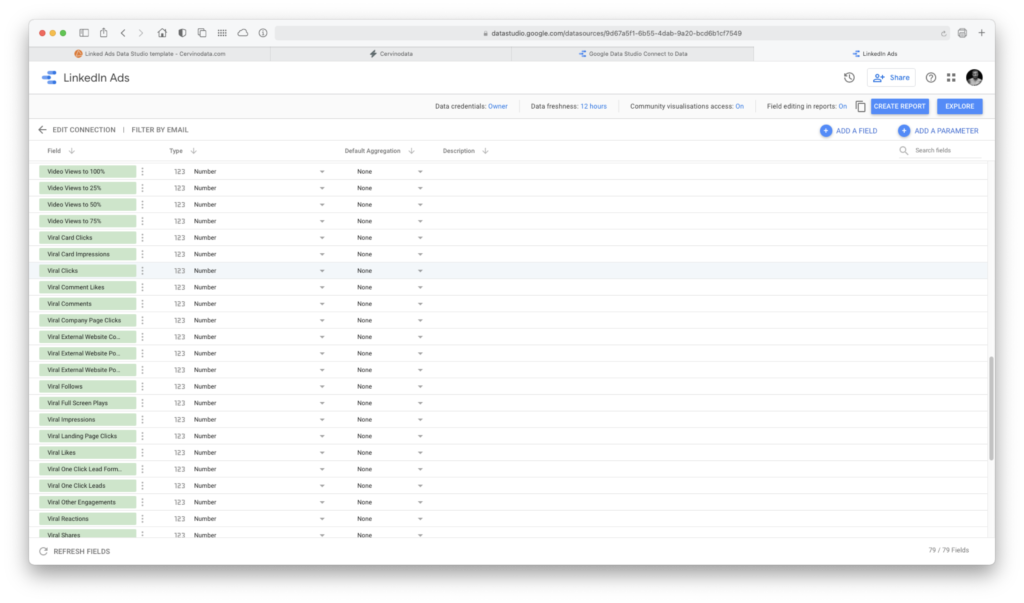
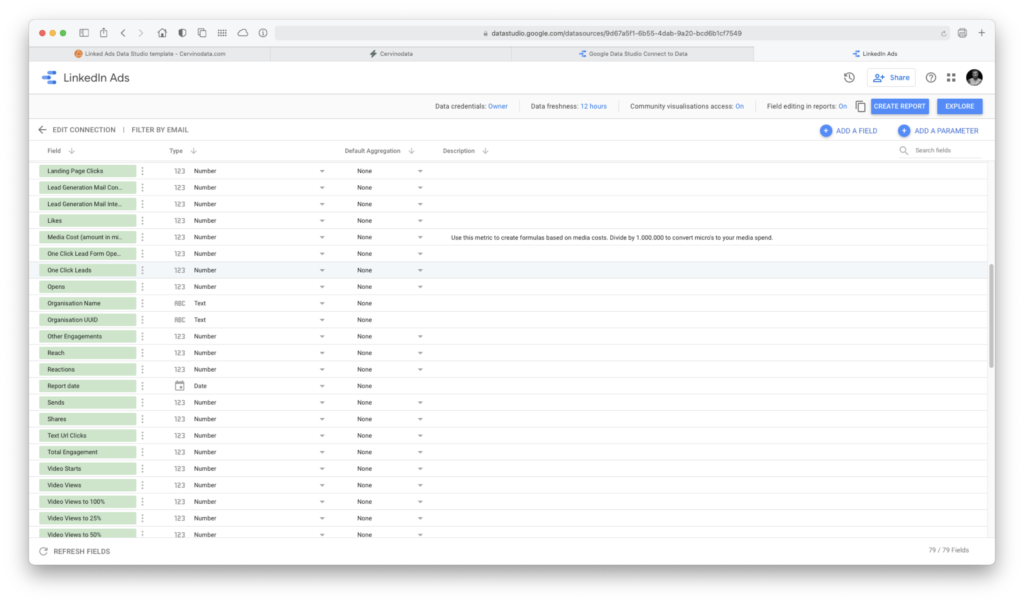
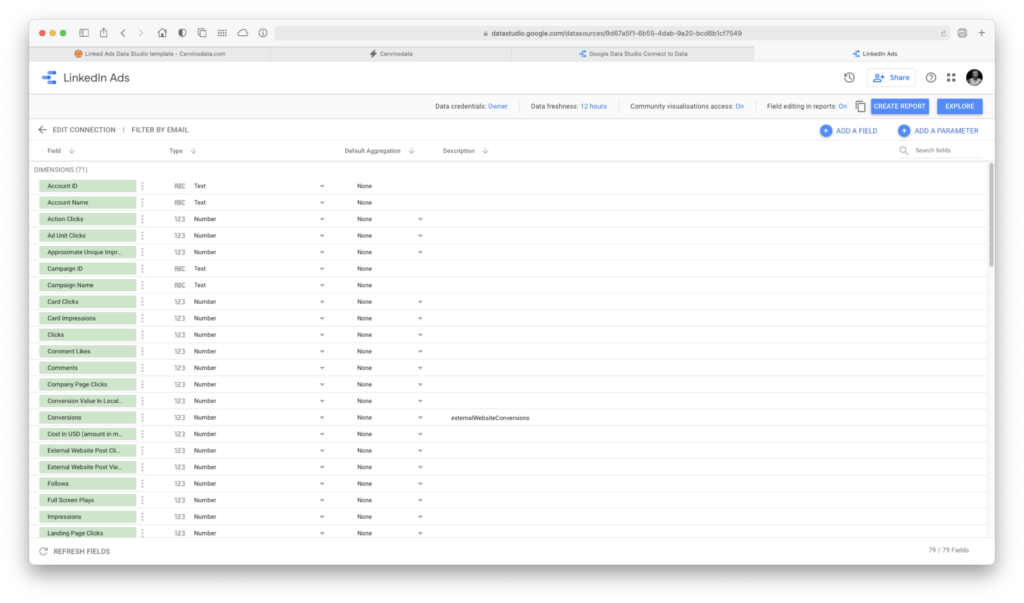
Cervinodata's pre-built Data Studio report for LinkedIn Ads is showing the topline performance metrics, a few key metrics and a set of calculated metrics. But inside the data set of this template, a whole lot of LinkedIn Ads metrics are available. See the screenshots on the right to get a detailed view.
How to add a LinkedIn Ads account to the Data Studio template
This short, step-by-step instruction shows you how to add an account to your Data Studio dashboard. This instruction assumes you already have the following:
- a Cervinodata account (start your free plan here)
- At least one Organisation created (we'll call it Organisation A in the example).
(Cervinodata comes with a "Default Organisation", but you can create your own.) - You have chosen "Organisation A" when you connected the template to Cervinodata .
- Make sure you are logged into Data Studio.
In Cervinodata
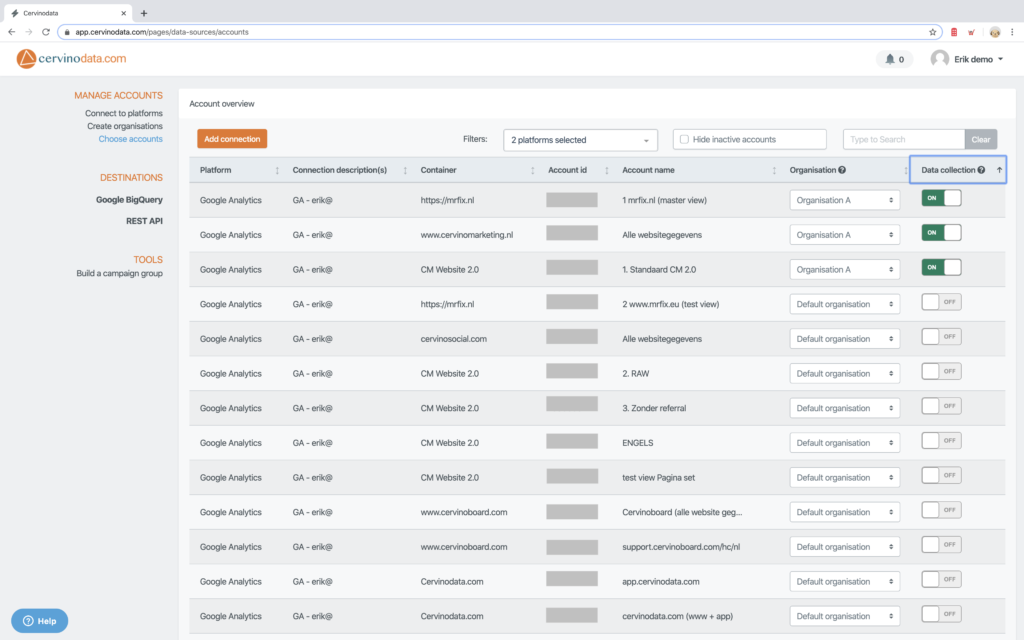
- Connect the account to Organisation A (in our example)
- Switch the data collection to ON
- That's it.
In Google Data Studio
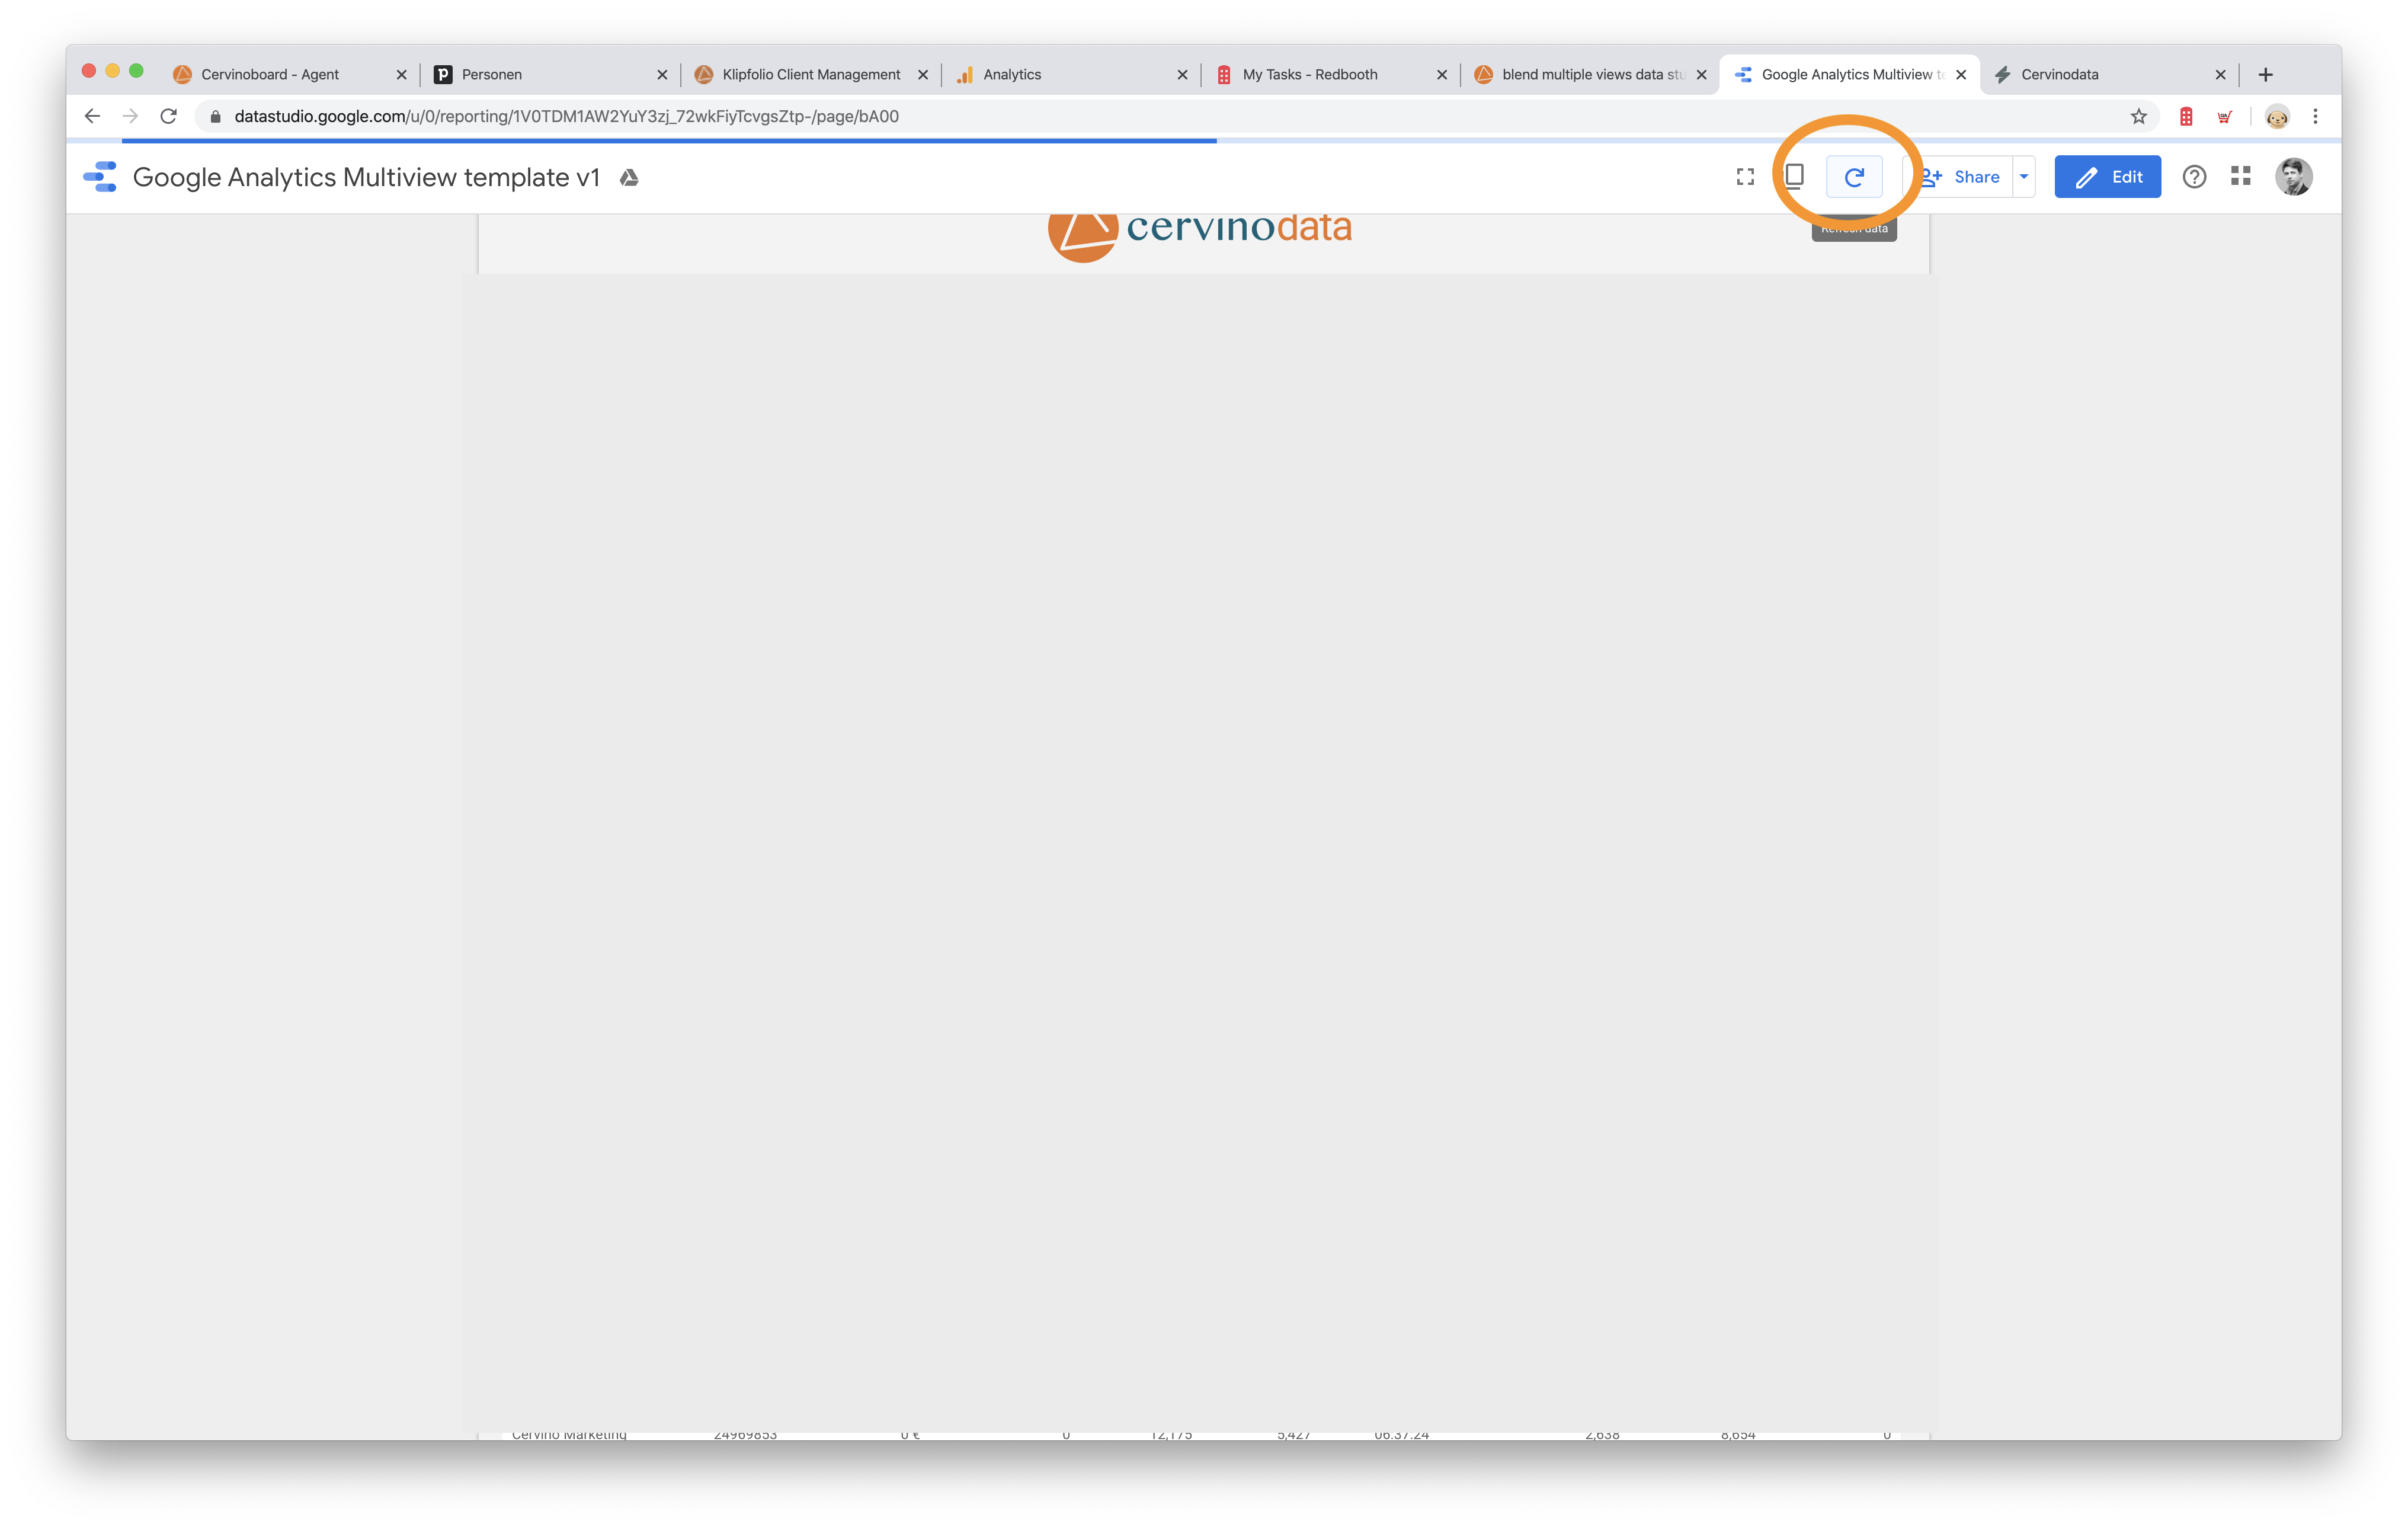
- In Data Studio, refresh the report to reflect the new data. The account you newly connected to the Organisation A will appear in the Google Data Studio dashboard.
How to remove a LinkedIn Ads account from the Data Studio template
This short, step-by-step instruction shows you how to add an account to your Data Studio dashboard. This instruction assumes you already have the following:
- a Cervinodata account (start your free plan here)
- At least one Organisation created (we'll call it Organisation A in the example).
- You have chosen "Organisation A" when you connected the template to Cervinodata .
- Make sure you are logged into Data Studio.
In Cervinodata
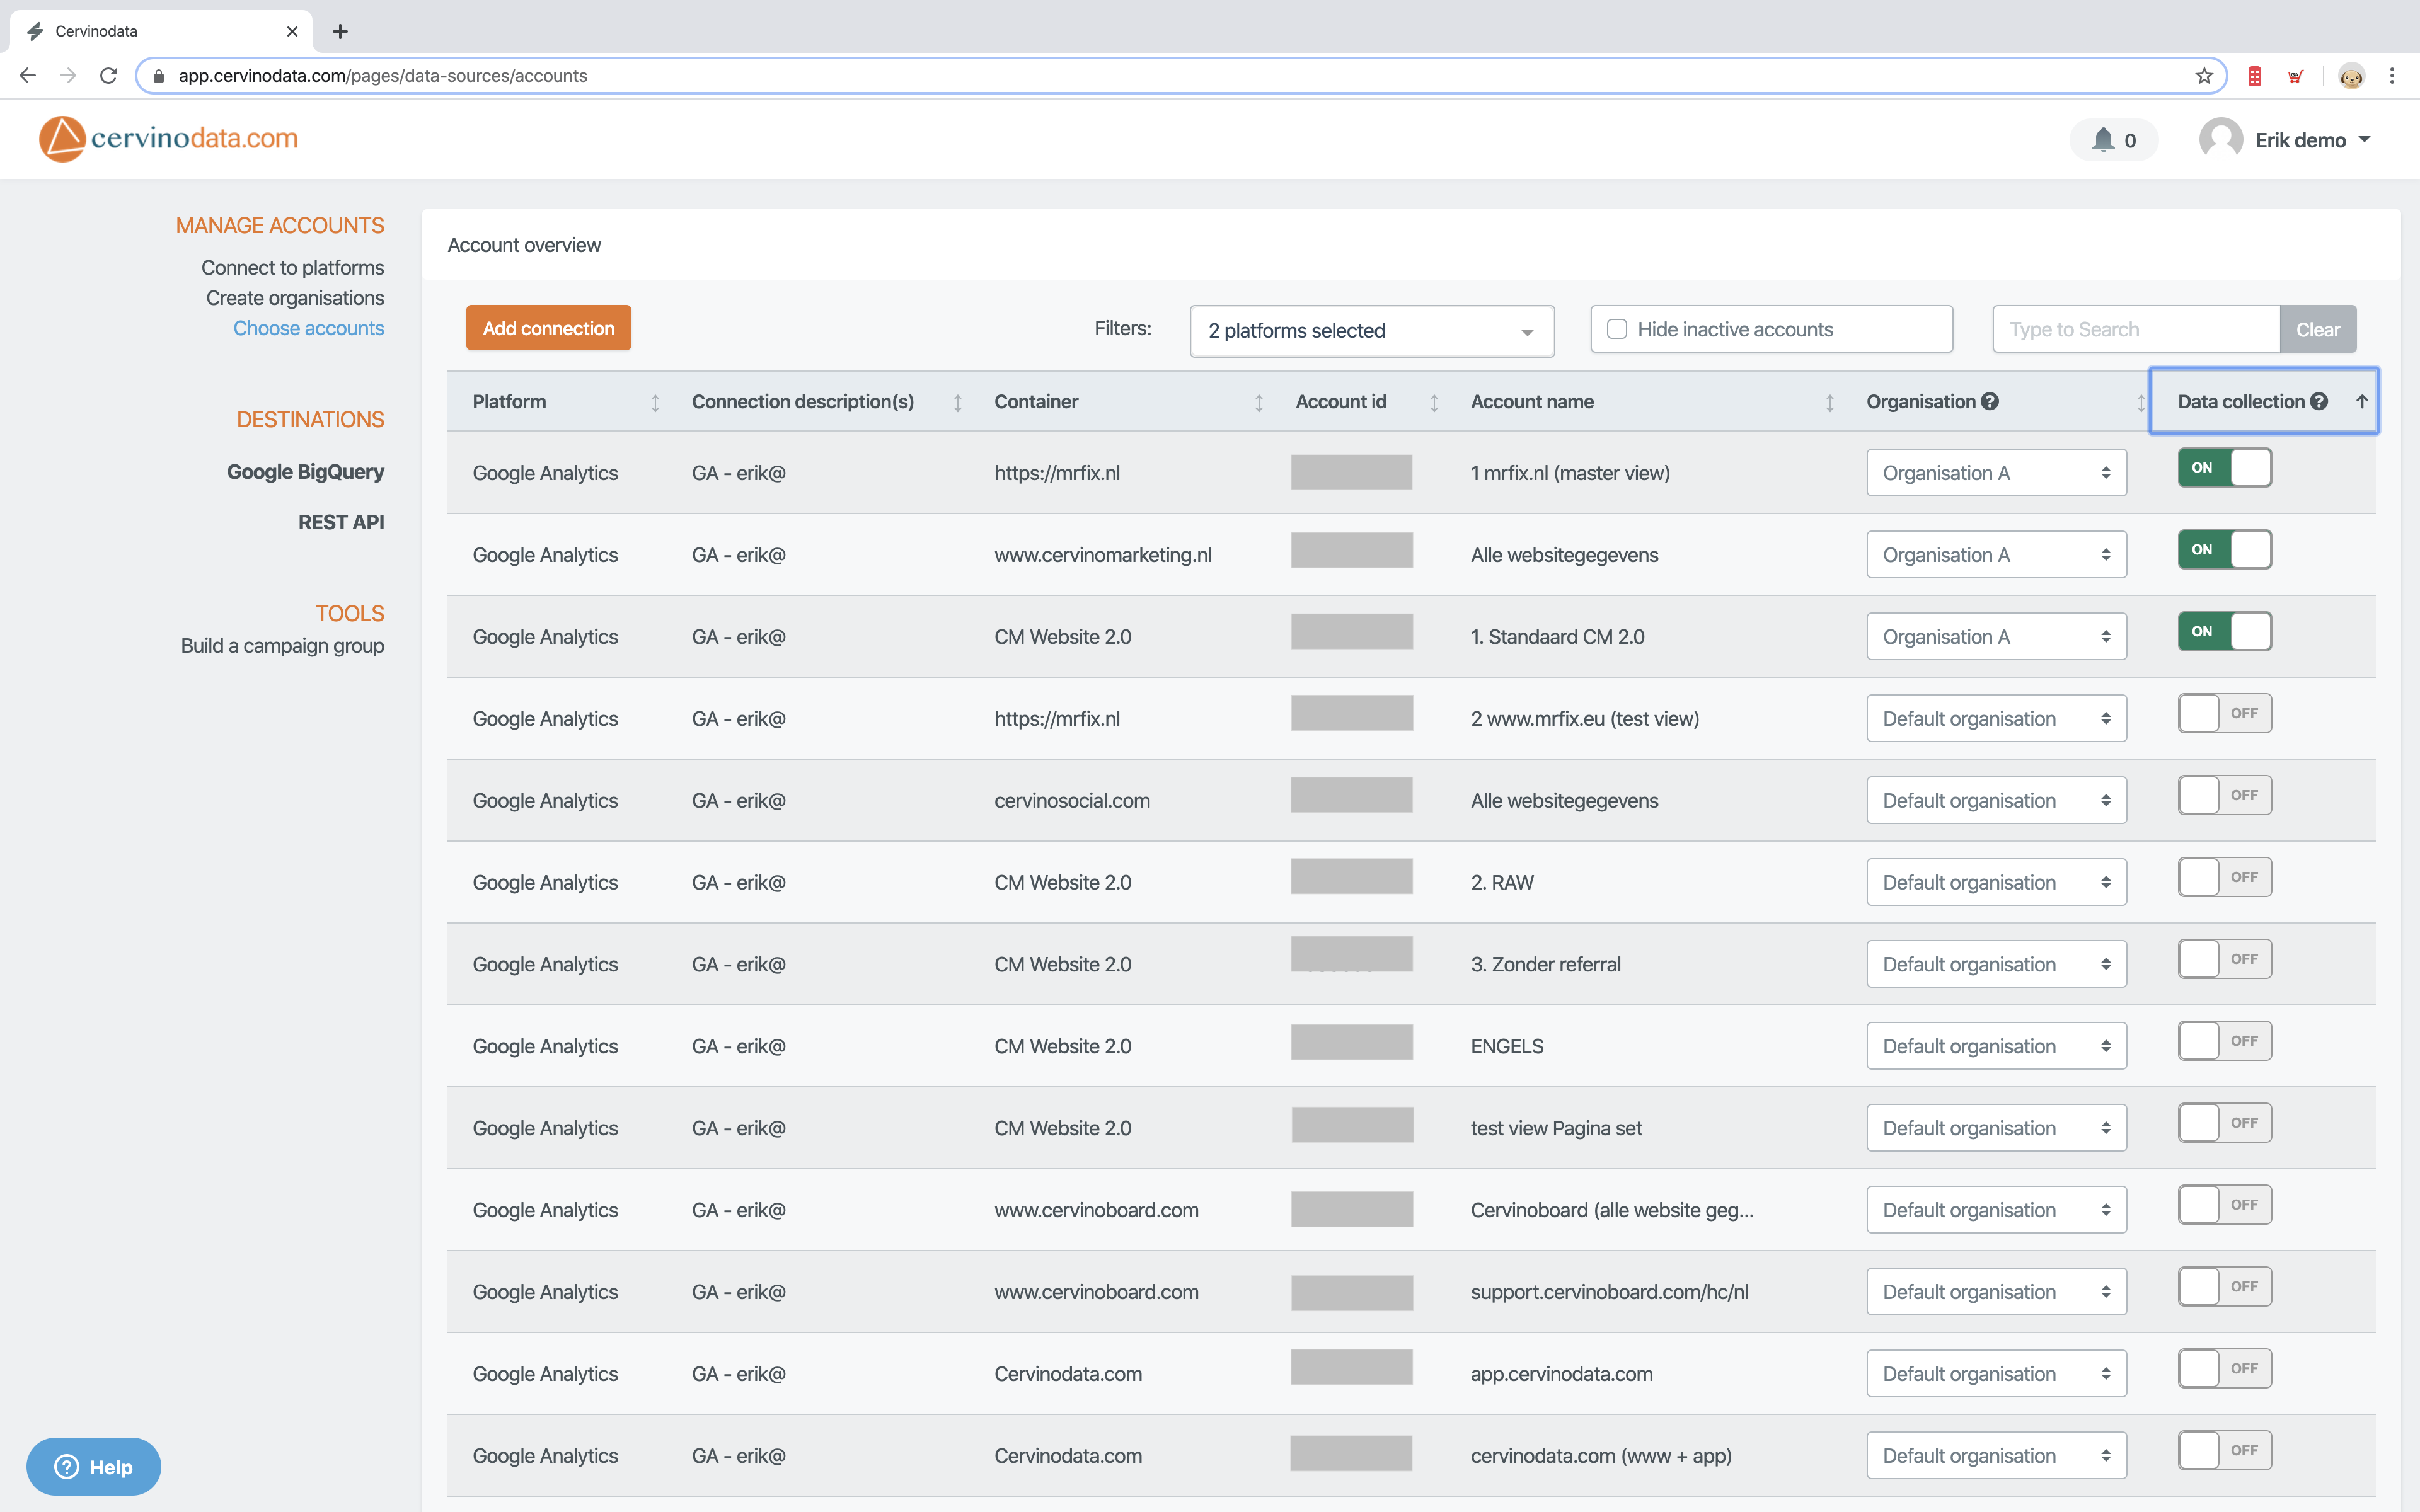
- Go to the "Choose Accounts page" (here)
- Scroll to the account you wish to remove from your Data Studio dashboard.
- Click on the dropdown with Organisation A (in our example) and select another Organisation (Let's choose "Default Organisation" in this example)
- Or you can switch the account to OFF. In this case, also the data collection stops.
- That's it.
In Google Data Studio
- In Data Studio, after a few minutes, refresh the report to reflect the new data. The account you disconnected from Organisation A or switched to OFF is no longer visible in the dashboard.

Start a Cervinodata Free plan
Our free plan comes with 182 days data retention and weekly data refresh. Blend data from multiple ad platforms (like Facebook Ads, Google Ads and more) with Google Analytics and get your campaign performance reporting up and running in minutes. Free templates available.

