What is Google Data Studio?
Google Data Studio is a free dashboard and reporting platform offered by Google. It offers native connections with the Google Stack (like Google BigQuery and Google Sheets) as well as a growing list of third party community connectors. Cervinodata is one of them. This free tool is used by agencies, small and midsized organisations but increasingly also by larger corporates.
Data Studio's main advantage is that is simple to get started. This article explains the key features of Data Studio and shows it's most important use cases.
Data Studio Pricing
As mentioned, Google Data Studio is a free to use tool. However, when using a reporting tool like this, you need to consider other aspects that might involve costs.
- Labour hours: Your time or your team's time needs to be accounted for. Calculate for half a day (up to one day) to get started and a couple of hours for each reporting page. After the initial learning curve, most of the time will be used to get the right data prepared for your dashboard.
- BigQuery costs: If you plan to connect Google BigQuery to your Data Studio reporting (why this is a good idea, see below). It all depends on how much data you re using and how many queries you run. Calculate for some costs, but only if you think you are a heavy user. See details of BigQuery costs here
- Third party connectors & tools: As soon as you are using multiple ad accounts or Google Analytics views, it start making sense to use 3rd party data preparation tools like Cervinodata or Supermetrics. These tools have a free trial but after that there is some license fee involved, but they will save you a lot of time.
Connecting to platforms & data
Data Studio offers a wide variety of ways to get the right data into a report. There is a distinction to be made between Google's native connectors (from the Google Stack) and non-Google platforms (like Facebook, etc).
Native Google Connectors
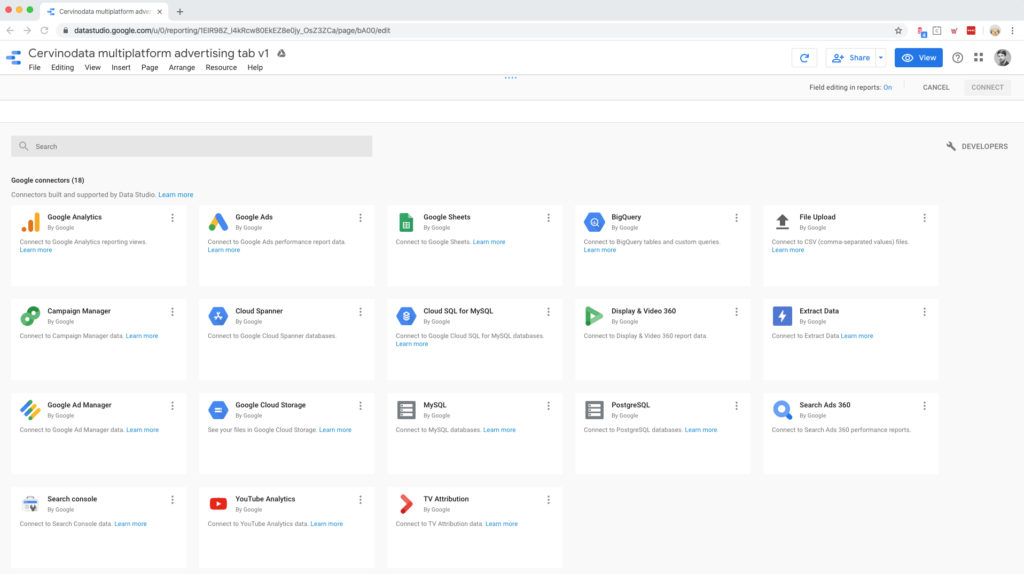
Google Data Studio has connectors to most of the Google Stack.
Advertising and analytics platforms.
- Doubleclick Campaign manager
- Google Ads
- Google Analytics
- Youtube
Data storage platforms
- Google BigQuery
- Google Cloud SQL
- Google Spreadsheets
Free data studio template
Cervinodata offers a free Data Studio template from the connector gallery. More information can be found here: data studio template
Third party Connectors
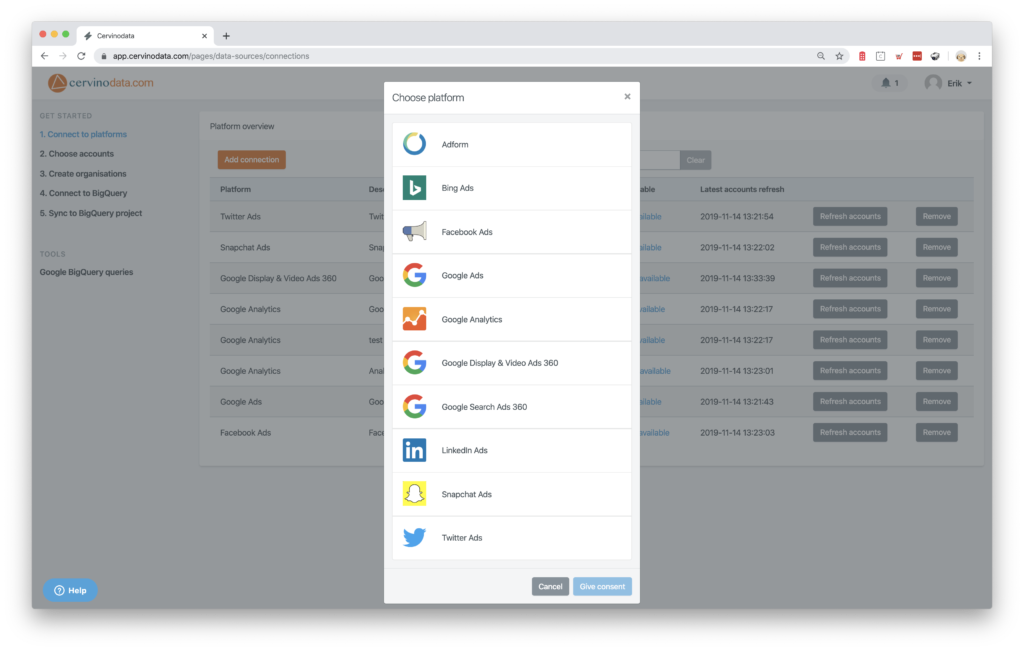
Google offers a growing list of plug-ins:
Advertising and analytics platforms
- Adform (via Cervinodata for BigQuery)
- BingAds (via Cervinodata for BigQuery)
- Facebook Ads (via Cervinodata for BigQuery)
- LinkedIn Ads (via Cervinodata for BigQuery)
- Snapchat Ads (via Cervinodata for BigQuery)
- Twitter Ads (via Cervinodata for BigQuery)
Data storage platforms
- MySQL
- PostgreSQL
More platforms
About the Native Connectors
The Native Google Connectors are very powerful. Most Google Stack users will see the benefits of connecting directly between the source of the data and Data Studio. Data is widely (and directly) available and connecting is straight forward.
Downsides
There are a few things to consider before you start using the direct connectors. In particular for the advertising and analytics platforms.
- For Google Analytics, for example, you might run into the sampling issue when reporting on longer periods or larger data sets. This issue can be solved either by upgrading to Google Analytics 360 or query shorter time periods and glue these data sets together before you use it in your reporting tool.
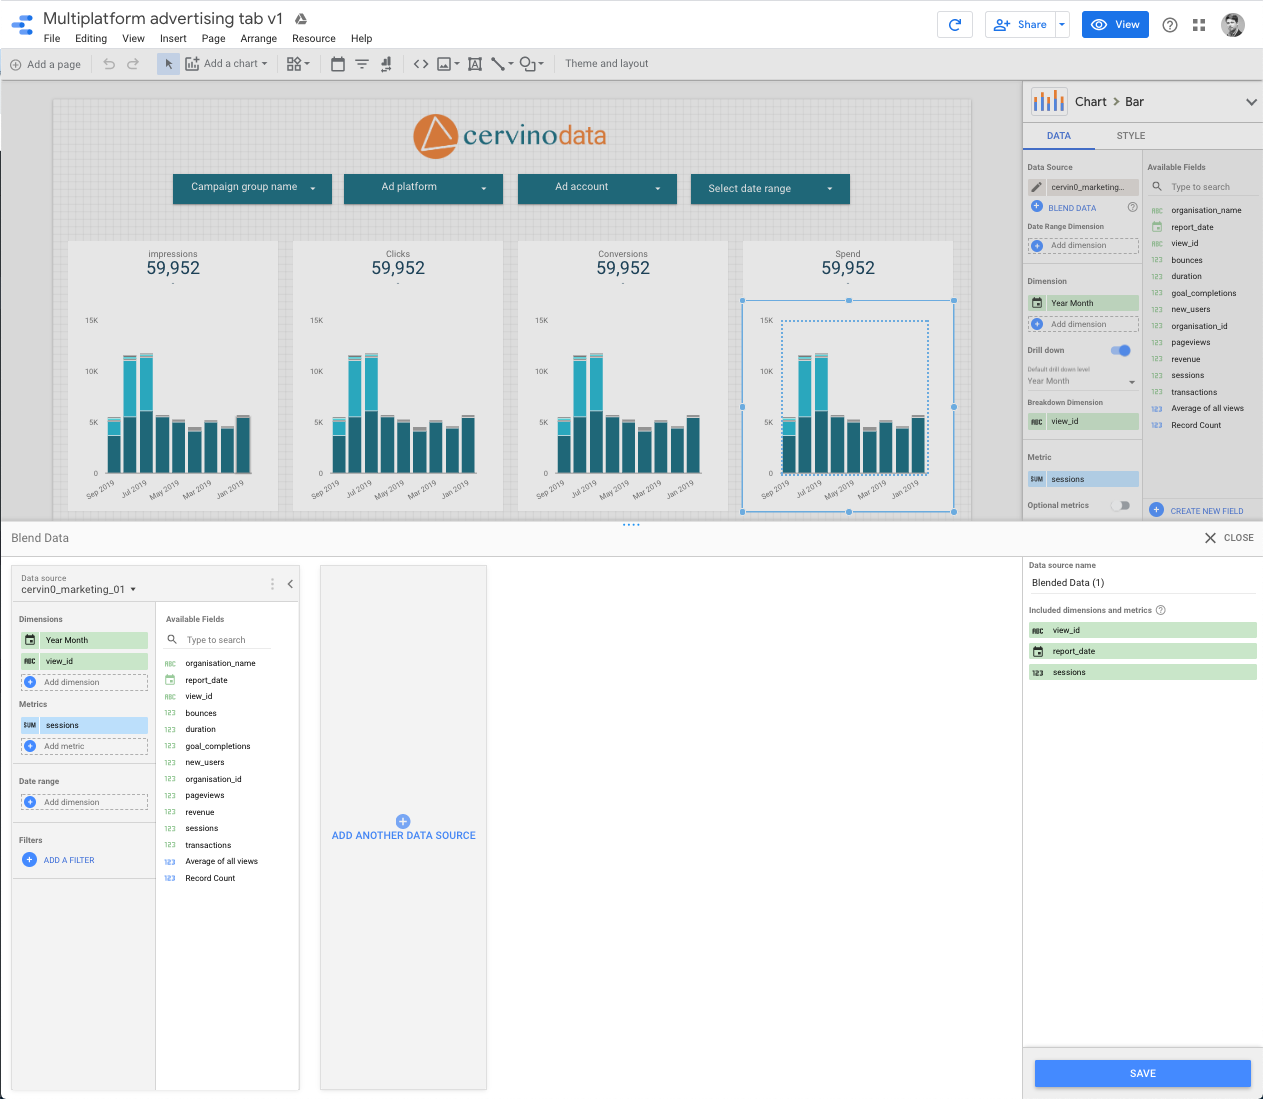
- Combining data from multiple ad platforms or multiple Google Analytics views is possible (using data blending) , but if you need to do this frequently of for more than a couple of data sets, it starts taking more of your time.
- Combining data of multiple clients might be tricky, if you want to prevent double work or when you want to prevent one client potentially seeing the data of another client.
If any or all of the issues above occur, it makes sense to store the data first and pre-process the data before you use it in your report.
About Google data storage platforms
Google Offers multiple ways to store data for use in Google Data Studio or other Reporting and Business intelligence tooling.
- Google Spreadsheets: This is Google's equivalent of Microsofts Excel. It's great if you have a modest amount of data and a modest number of platforms you need to store for use in a report. Google Data Studio (and platforms like Infogram and Klipfolio) can be connected to Google Spreadsheets. If you need to fill more than a few dashboard (for instance if you are an agency or larger organisation), you will likely need a long list of separate sheets. This will reduce the control over the data, risking your data privacy. In that case, you are better of with Google BigQuery.
- Google BigQuery: This is Google's powerful and fast storage facility. And above all, it's a cheap solution. Key benefit is that all your data is centralised in one place. From there, you can distribute it to one or more Google Data Studio dashboards. Since Google BigQuery is a database solution, it is possible to create a relational data model. This allows you to easily combine data from multiple accounts, platforms or clients and place it into one table for use in Google Data Studio. Tools like Cervinodata for BigQuery or Supermetrics for BigQuery that help you get all the data in BigQuery. See our comparison here: Supermetrics vs Cervinodata
Transforming the data
Google Data Studio allows you to include formulas that allow you to transform your data in the way you wish to present it.
- Data blending: it is possible to combine the data from multiple data sets. This is convenient if you want to present data from multiple data sets into one graph or table. For instance if you wish to show how your ad campaigns are doing compared to a target or budget.
- Calculated metrics: Allows you to include a formula that uses multiple other metrics. For instance "Total Spend" would be the spend of platform A + spend of platform B + spend of platform C.
- Advanced functions: For the tech savvy users, there are advanced functions available so you can build more complex formulas using mathematical functions.
Tip: How to avoid repetitive tasks
If you need to blend data on a regular basis (for instance if you need to build dashboards for multiple customers) or if you wish to re-use calculated metrics and advanced functions, it makes sense to do this outside of Google Data Studio.
3rd party tools, like Cervinodata, allow you to create a calculated metric once and re-use it in all your reports.
Visualising metrics
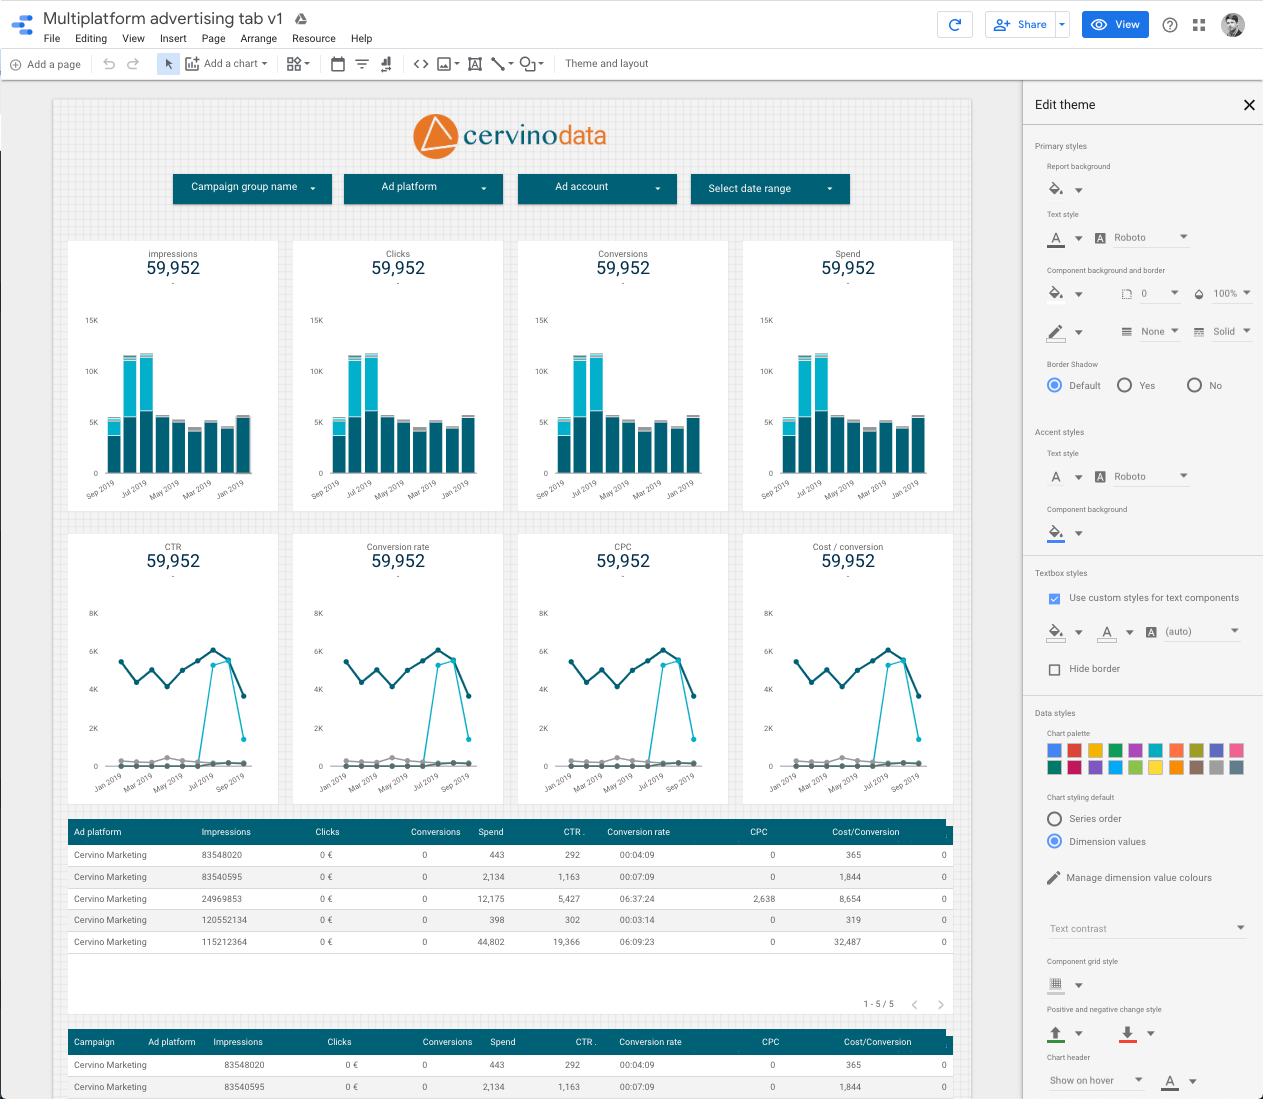
At the launch of Google Data Studio, the different ways of visualising the data was fairly limited. But more and more formats are becoming available. And recently, Google added a custom visualisation tool that allows you to build visualisations yourself (mainly based on D3js formats).
- Customisation of look & feel: The graphs can now be customised in color, font size, line thickness and type (line or bar chart).
- Filters: It's quite easy to add a filter to your data (like a start-end date selector). Just drag it in and enable the graph or table to react to that filter. Please note that your data needs to be available based on your visualisation needs. For instance, if you want to be able to select a specific start and end date, you need a date dimension where the data is split per day.
- Indicators: It is now possible to change the color of a metrics when a certain target is reached (for instance if you meet your revenue goal, the metric with your revenue turns green. Please note that Google Data Studio needs a second number to compare to know when to turn red or green. This means you either have to hard code a number or refer to a second metric (your revenue target). In case you have moving targets, it might make sense to add a column ("revenue target") to your data set or blend the data set with the targets with the data set containing the actual revenue.
Start a Cervinodata Free plan
Our free plan comes with 182 days data retention and weekly data refresh. Blend data from multiple ad platforms (like Facebook Ads, Google Ads and more) with Google Analytics and get your campaign performance reporting up and running in minutes. Free templates available.
Sharing dashboards & collaboration
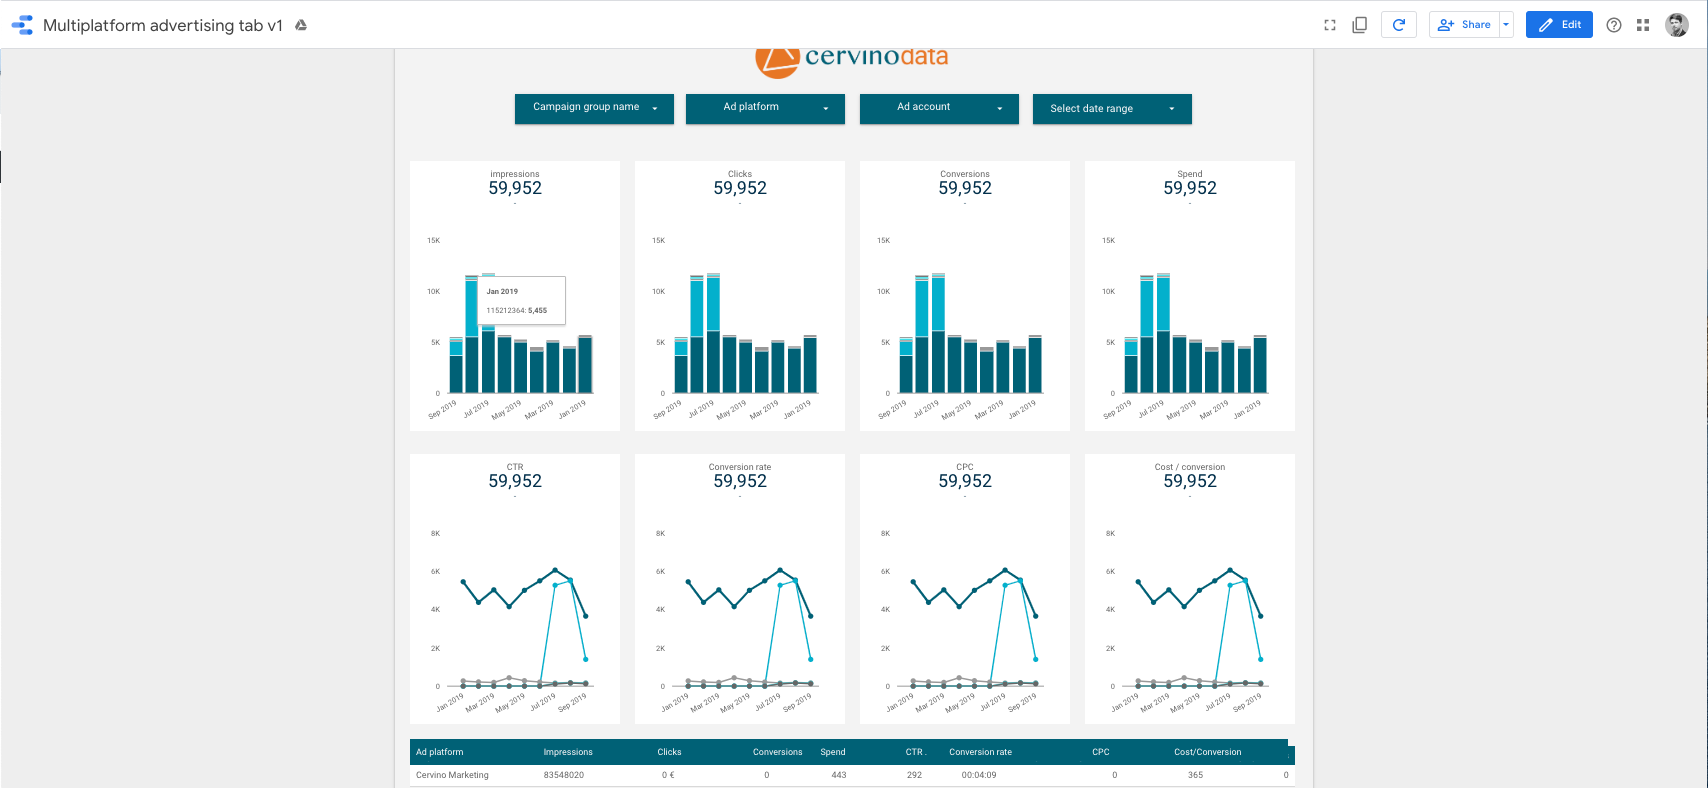
As Data Studio is built on Google Drive technology, the sharing options are similar.
- Viewing and Editing: A user can have viewing rights or editing rights. The owner (admin) kan define the rights for each user.
- Collaboration A cool feature is the possibility to work on a report together, at the same time, as with Google Sheets or Google Docs.
Branding
Since it is possible to change the colours of the graphs, the background and it's possible to add images (like a logo) and texts, it is quite easy to change the dashboard in such a way that it reflects your brand.
- If you create a reporting template in Google Data Studio it is easy to re-use the look & feel of the dashboard for other projects or clients.
- See more details about Cervinodata Data Studio templates here
- Get started with a Data Studio template
- More templates can be found here: https://datastudio.google.com/gallery
About Cervinodata
Cervinodata is a clever data collection and management tool that helps organisations save time creating dashboards. Cervinodata connects to Google Data Studio and other reporting tools and stores all relevant data in one central place. From Cervinodata, customers can feed data into the required reporting tool.
If you are interested, you can start a free trial for Cervinodata here.
Cervinodata works with Google BigQuery, and we're launching a native connector to Google Data Studio very soon. If you want to know more about this, drop us a line: datastudio@cervinodata.com
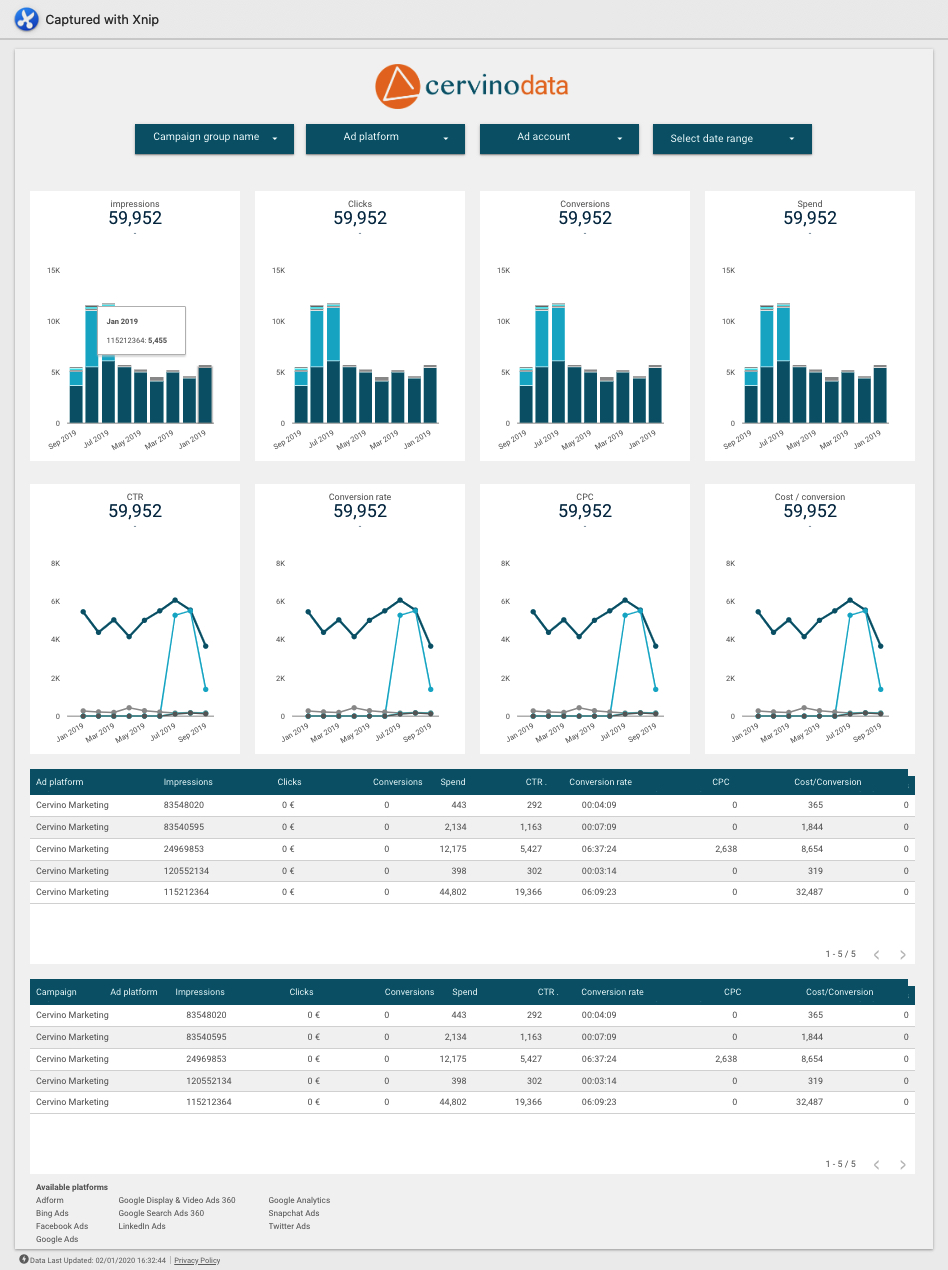
Mockup of Cervinodata template
Further reading
See more related articles here:
Available Cervinodata templates for Google Data Studio
All these Google Data Studio templates are free to use. Pick any, or all, templates and use Cervinodata to keep your dashboard up-to-date.
Go to Get started with Cervinodata if you need help setting up Cervinodata.
Multiple ad platfoms & accounts
Report on the key performance of ad accounts from multiple ad platforms in one elegant and powerful dashboard.
Multiple Google Analytics views
See the ecommerce performance and goal completions of multiple websites (GA views) together in this clear and ready to use data studio template.
Merge Ad campaigns + GA
Report on specific campaigns from multiple ad platforms (and multiple accounts per platform) and see how much revenue and transactions they generated (includes ROAS).
Facebook ads data studio template
Bring the key metrics of one or multiple Facebook Ads accounts together in one elegant dashboard, including smart & automatic filtering
Start a Cervinodata Free plan
Our free plan comes with 182 days data retention and weekly data refresh. Blend data from multiple ad platforms (like Facebook Ads, Google Ads and more) with Google Analytics and get your campaign performance reporting up and running in minutes. Free templates available.
