Klipfolio multi ad platform dashboard
Step by step instructions on how to build a Klipfolio multi ad platform dashboard.
About Klipfolio
With a Klipfolio dashboard it is very easy to build dashboards with data from multiple sources. Klipfolio offers a wide variety of data connectors. In some cases it might be faster to do some data preparation before you use the data in your dashboard. This article shows a step by step instruction on how to build a Klipfolio multiple ad platform dashboard.
The dashboard is built with Klipfolio's PowerMetrics technology, making it very simple to build advanced dashboards without any coding. Find more on Klipfolio PowerMetrics here.
About Cervinodata
The dashboard in this example is built with a data source that uses Cervinodata as the data feed. With Cervinodata, a user can bring the key performance metrics of multiple ad platforms together to use in one data source.
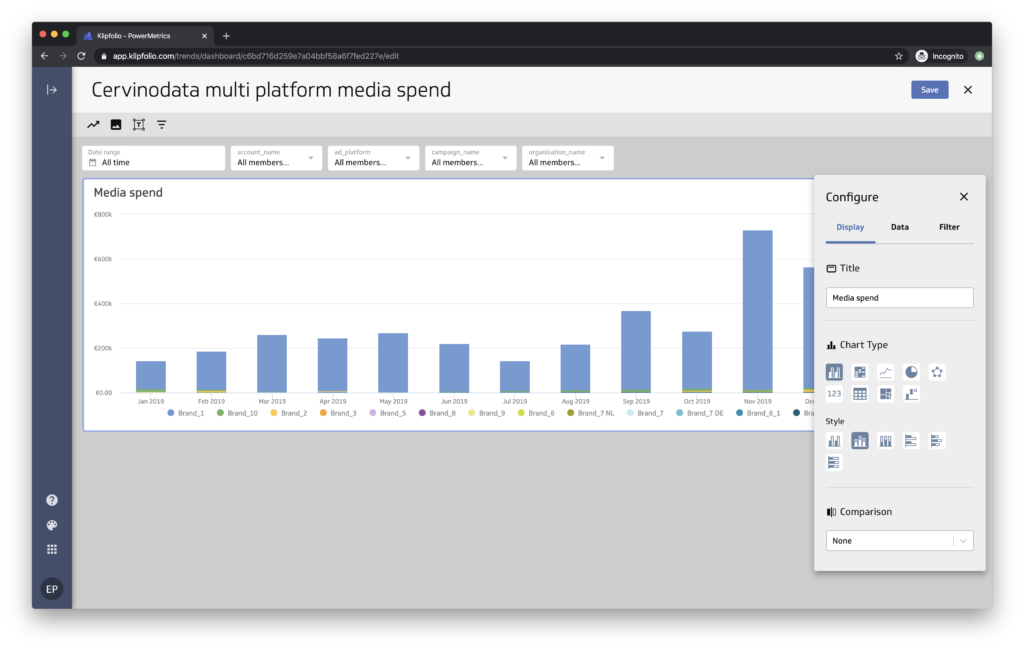
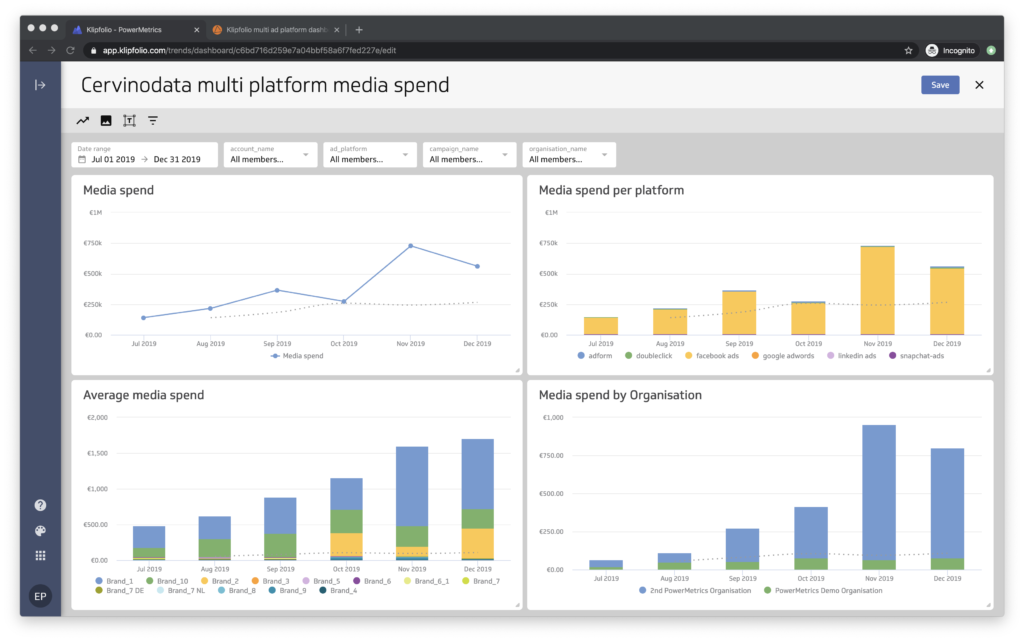
In the example below, the metric "Media spend" is coming from Adform, Doubleclick, Facebook Ads, Google Ads, LinkedIn Ads and Snapchat Ads. And the data is coming from 10 different brands from 2 organisations. Want to try Cervinodata? just sign up for a free plan here.
What's on the Klipfolio multiple ad platform dashboard?
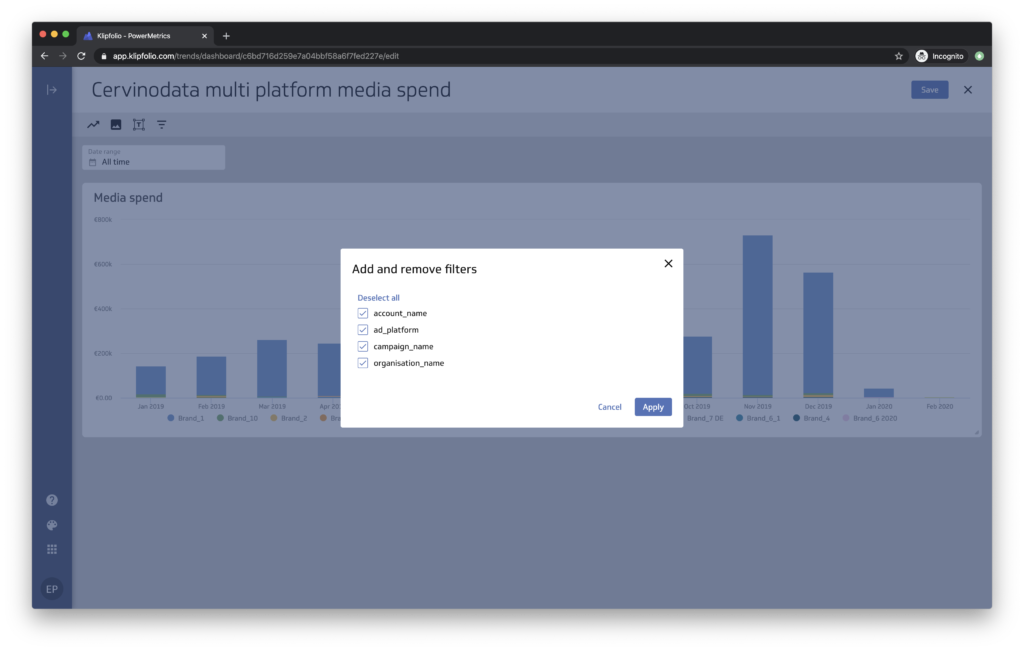
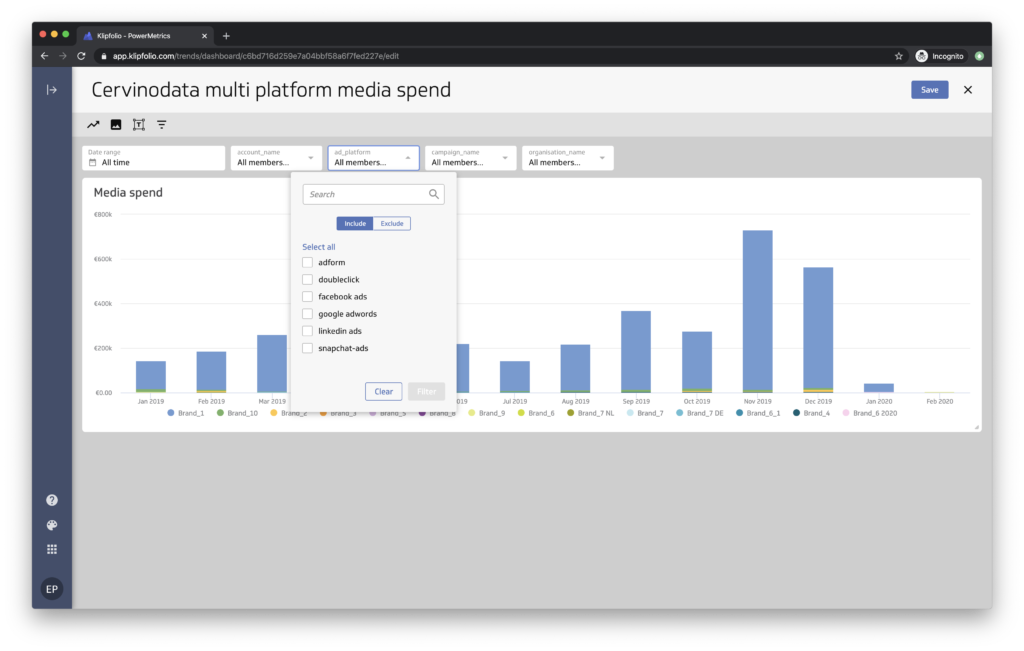
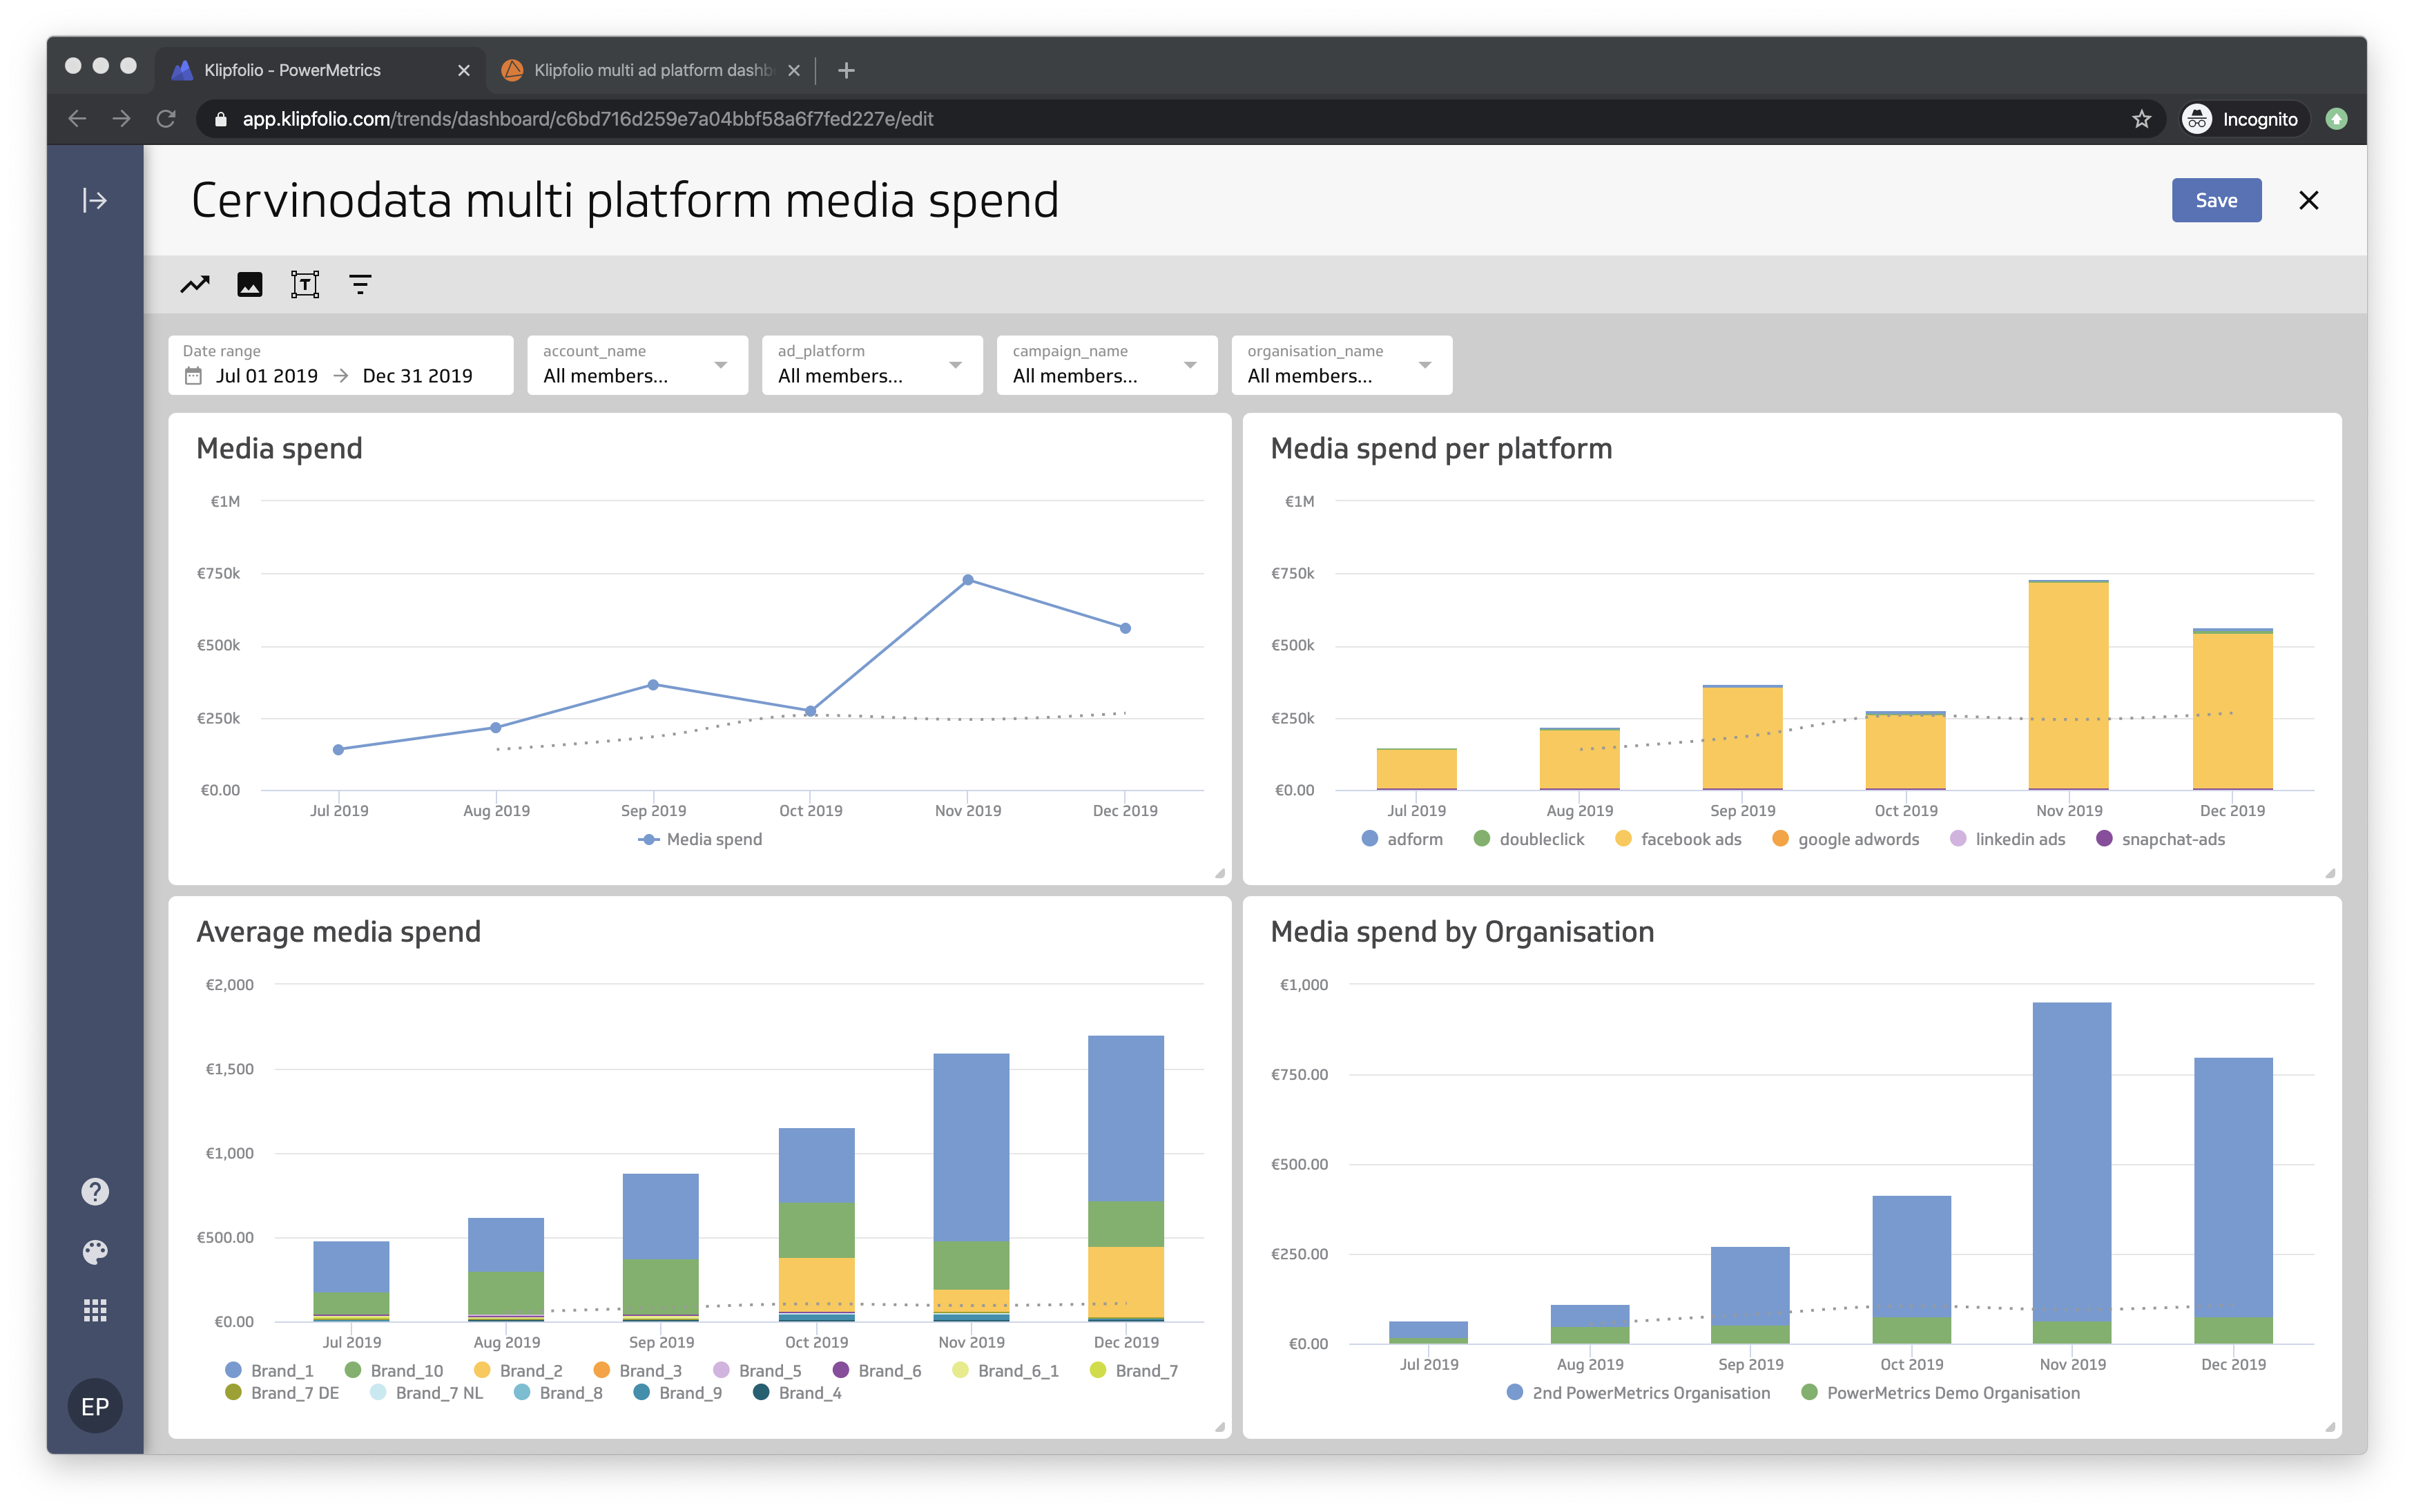
This dashboard shows the Media spend from multiple ad platforms, for multiple organisations with many brands.The top navigation shows a powerful data filter (with a date picker or a preset date range, like "Current year", "Last 6 months", etc) and a filter for each of the dimensions available in the Cervinodata multiple ad platform data source. What is powerful is that there's a multiple select option, so you can compare the performance between Brand 1 and Brand 4 or Google Ads vs Facebook Ads.
Follow the easy steps to build a PowerMetric
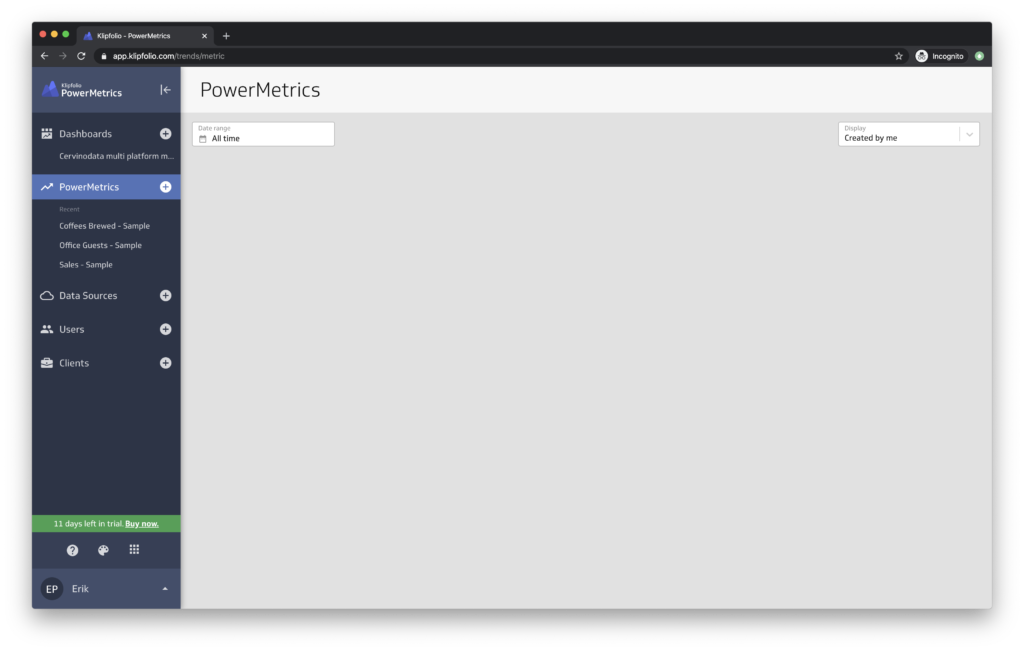
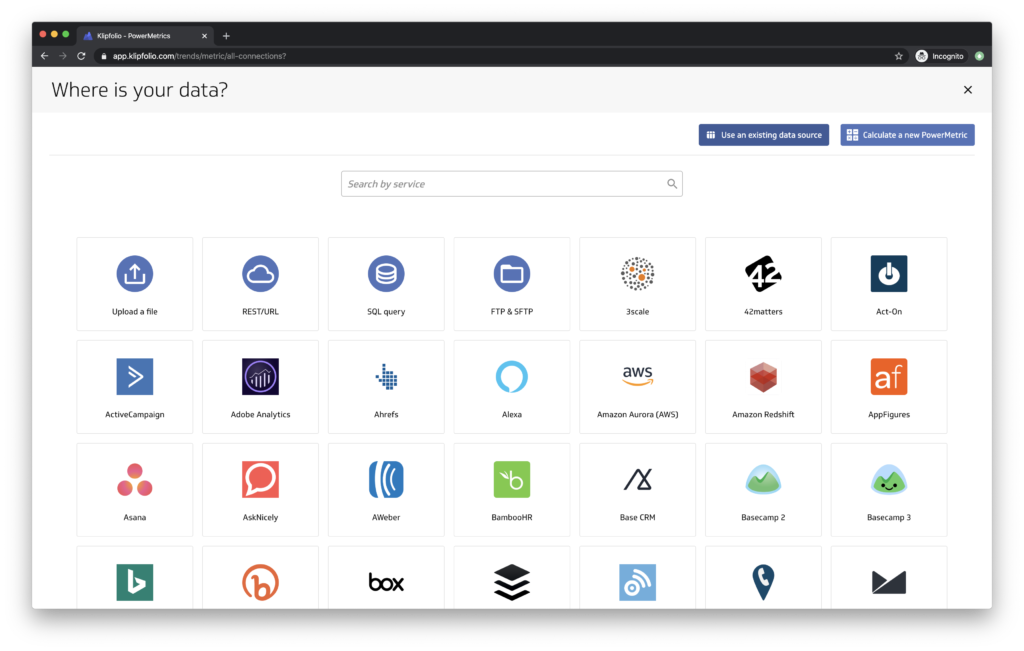
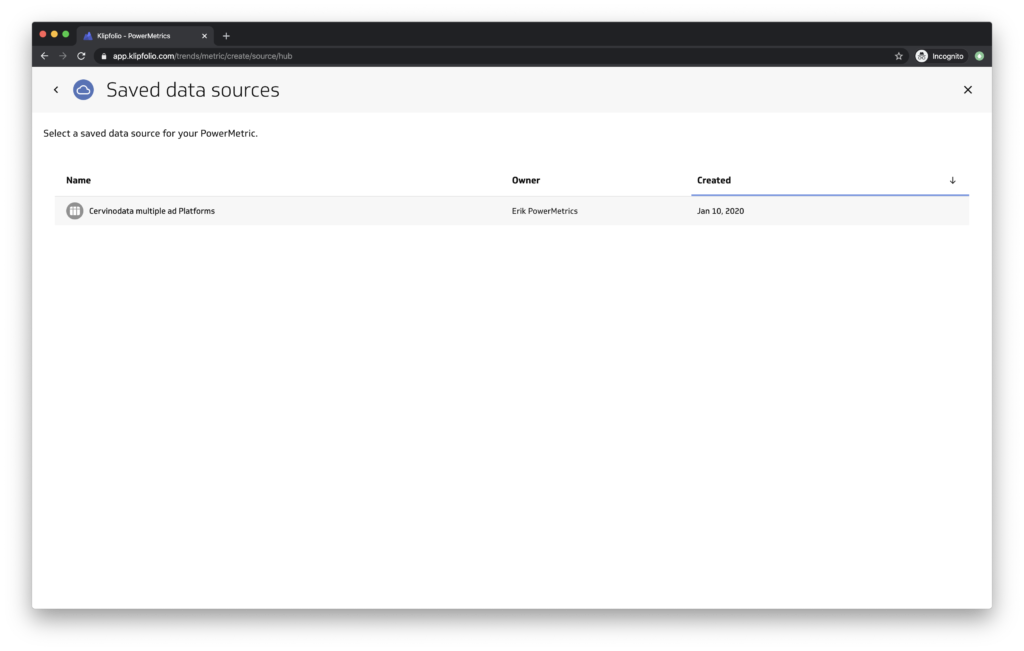
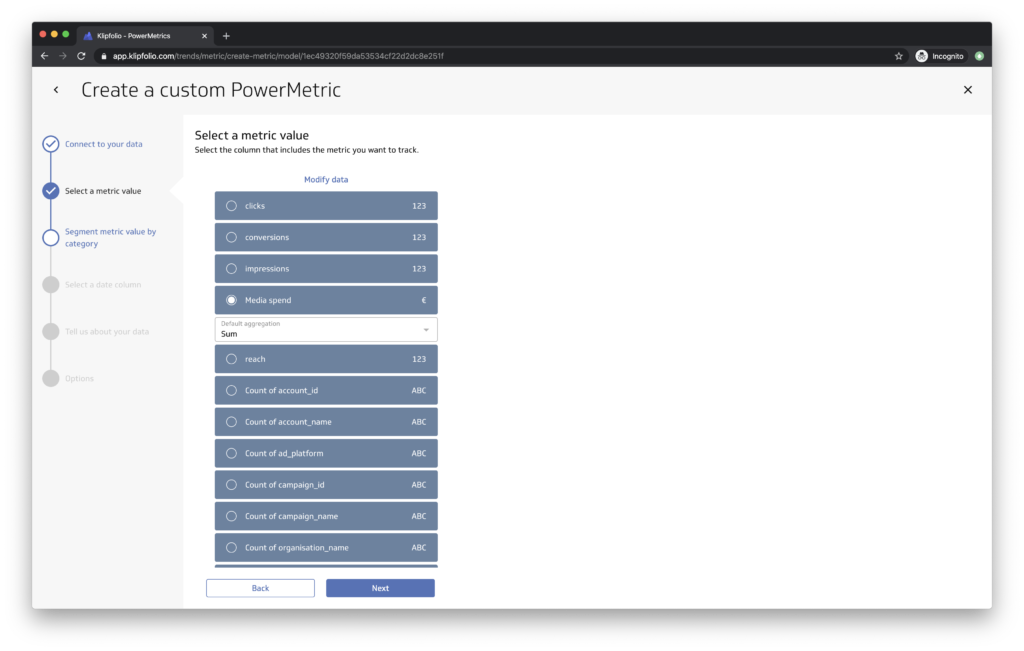
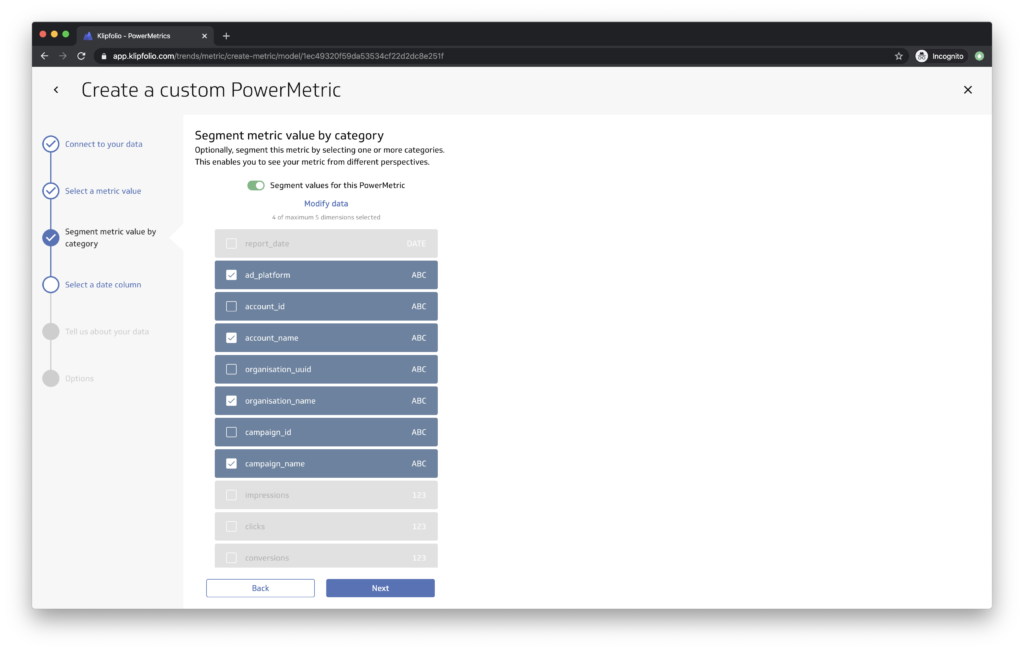
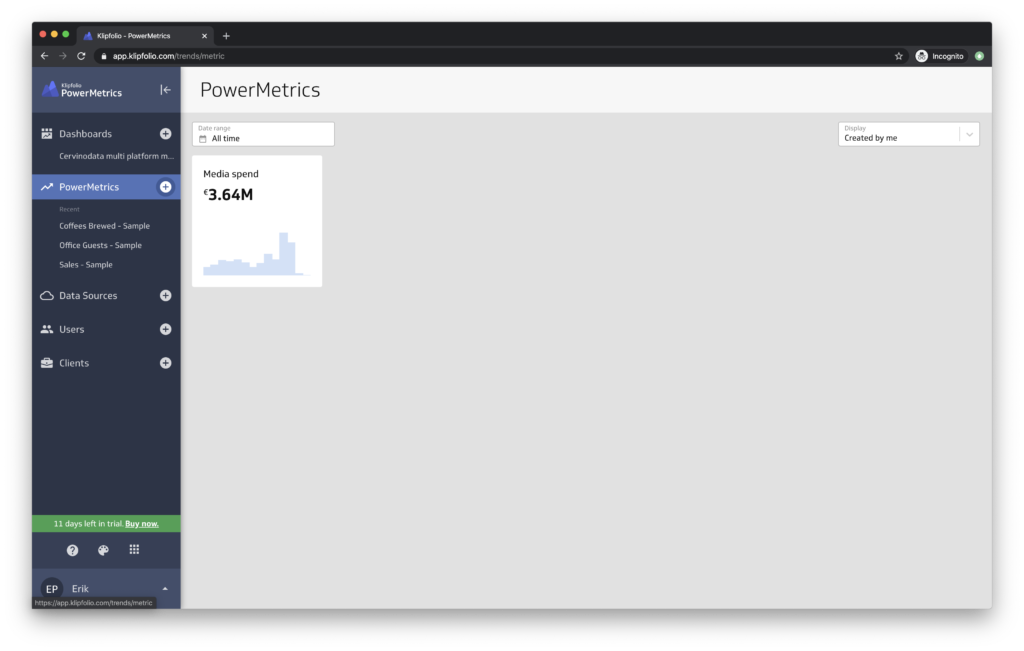
In the navigation panel, click the + sign behind PowerMetrics. You will be guided through a process that is very easy to follow. Klipfolio allows you to connect to a variety of data connectors and to create your own data sources. For the purpose of this example we have already created a Cervinodata data source to use. If you want to know how to create a Cervinodata data source in Klipfolio, click here
Step 2: Build a dashboard with the PowerMetric
A Klipfolio multi ad platform dashboard without coding
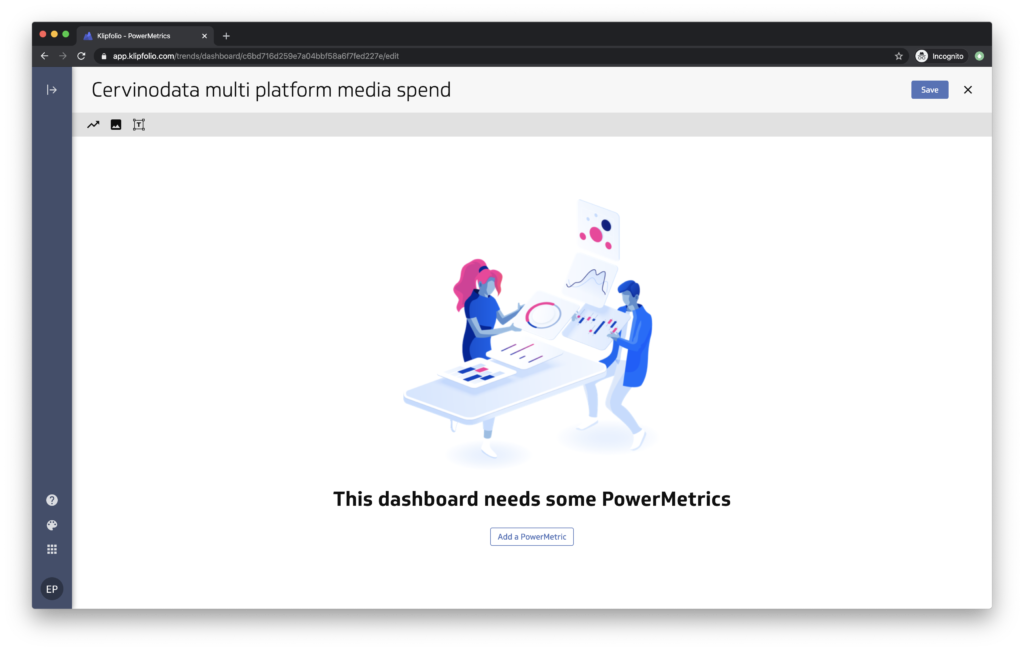
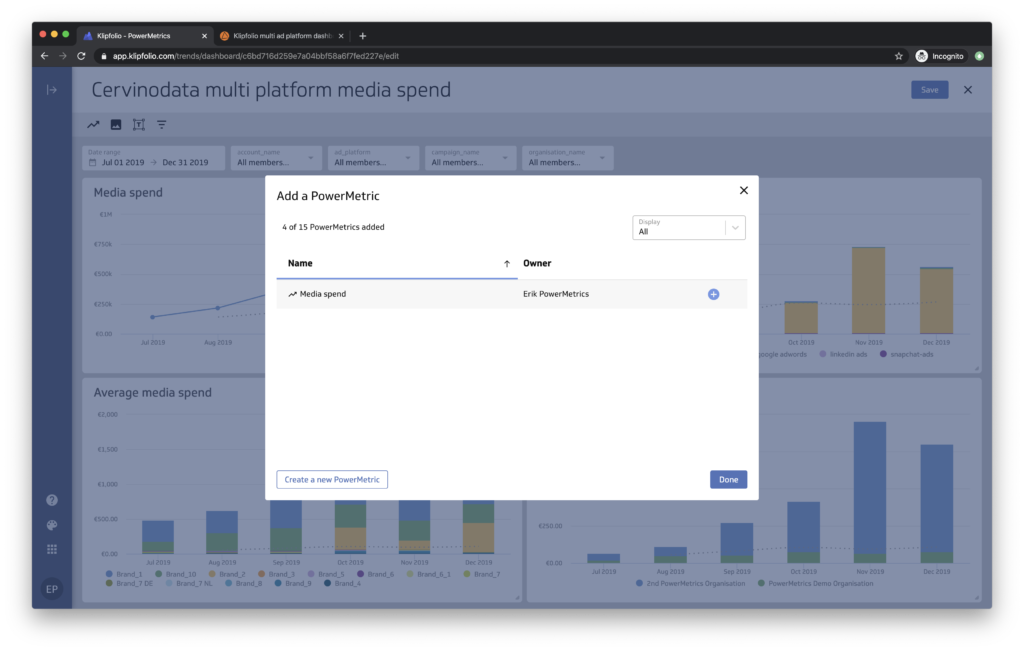
Now that you have create the Media Spend PowerMetric, it is very easy to add it to the dashboard. Follow the steps below to build it yourself.
It is good to know that a PowerMetric (the name says it all) is very powerful. It is possible to add the PowerMetric "Media spend" on a dashboard multiple times and visualise it in different ways. This allows you to get quick insight in the performance of your media spend from multiple platforms (and Organisations and brands) with 1 PowerMetric.
Step 3: Add other PowerMetrics to the dashboard
Since Cervinodata enables the user to bring the most important key metrics from multiple ad platforms together in one Klipfolio data source, adding PowerMetrics is very simple.
Adding a new PowerMetric to an existing Klipfolio dashboard
Just follow step 1 again, with a small difference
- Choose the same data source as before (the "Cervinodata multiple ad platforms" data source).
- Select another metric (like Impressions, clicks, conversions or reach) and follow the rest of the steps.
Then add the PowerMetric to the existing multiple ad platform dashboard.
- Because all the metrics are coming from the same Cervinodata data source, the dimensions that are used in the top menu bar will automatically work for other PowerMetrics built on the same Cervinodata data source (you need to make sure you check the same dimensions).

